Dustin Stevens-Baier
Neural Networks
Assignment#3
A. Copy of the code.
TSPGA.java
City3.java
TourCity.java
TSPSimulation.java
B. Report with:
1. Introduction describing the project and any observations you
made while building and implementing the simulation.
This project is solving Traveling Salesman problem using Genetic algorithm.
TSP is a NP hard problem of finding shortest route for traveling salesman to
visit cities once and return to starting city from where tour was started.
The genetic representation differs in two important ways from the last assignment.
First, it uses complete solutions, exact integer permutations. Second, it uses
multiple solutions in the form of a population which is simply a set of permutations.
The genetic approach iterates by adding and subtracting members of the
population, trying to improve on the overall fitness of the population.
Observations:
First, the simulation was run for two different cases: Case 1 Order
Recombination and Case 2 Distance Recombination. Second, for each case mutation
rates 0.0 (no mutation), 0.02 (2 in every 100 mutated),
0.04 (four in every hundred mutated) and 0.06 (six in every hundered mutated) were applied.
The Order method converged much faster than the Distance method.
In general I think the Distance method would give results closer to the optimal
tour but it would require more running time than the order method. This appears to be only true
for the TSP case.
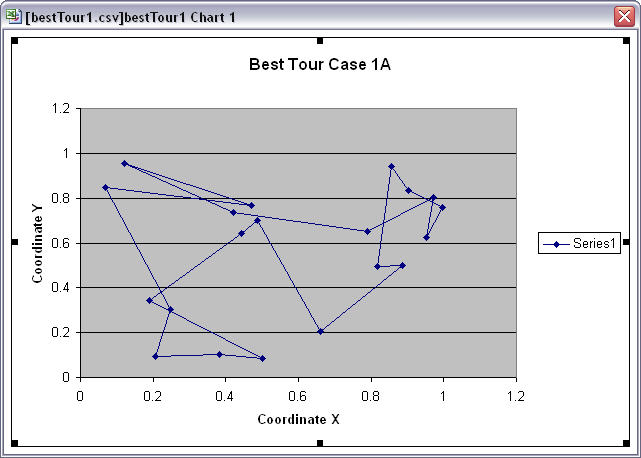
2. Case 1: Order Method and Mutation Rate 0.00%
a. Total generations: 281
b. Drawing of the best tour found
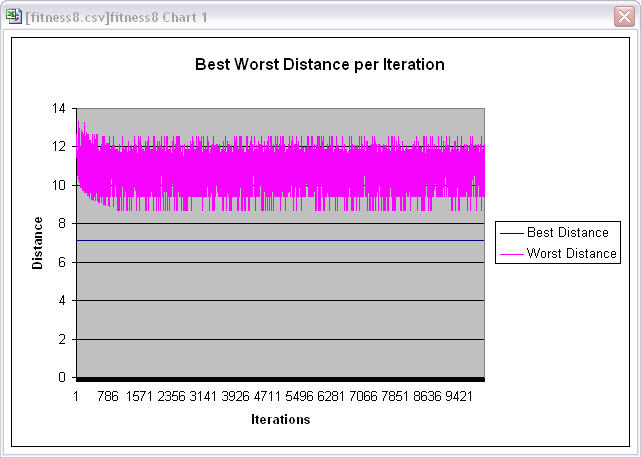
c. Plot of the length of the best and worst tour at each
generation (gives the range of fitness values for each
generation).

d. What do you think is the "best" mutation rate for this
problem? Explain.
The "best" mutation rate will probably be 0.06 because the higher the mutation rate the
higher the chance to find the optimal tour. However, this also means that the time of the
simulation will be longer.
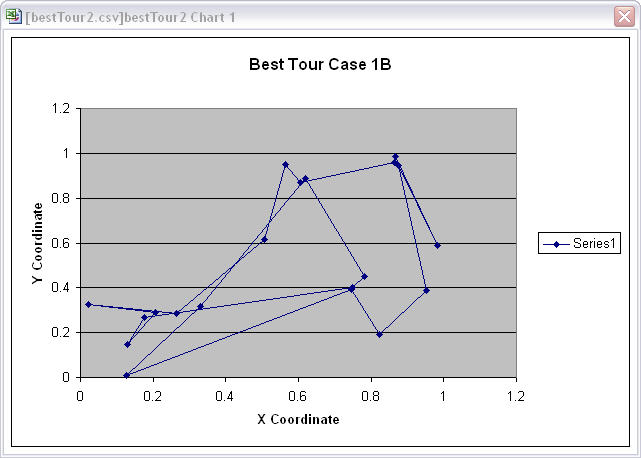
Case 1: Order Method and Mutation Rate 0.02%
a. Total generations: 206
b. Drawing of the best tour found
c. Plot of the length of the best and worst tour at each
generation (gives the range of fitness values for each
generation).

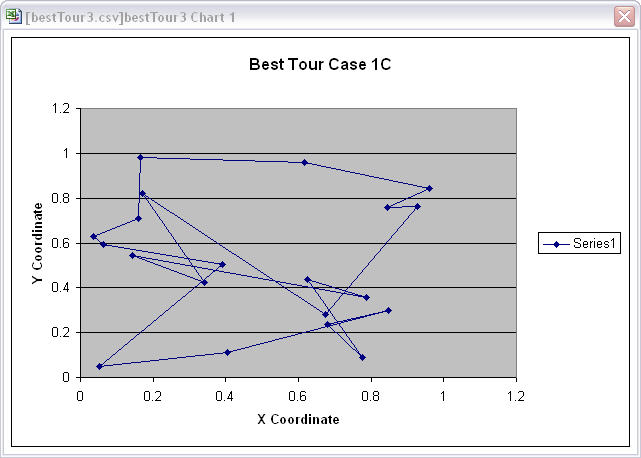
Case 1: Order Method and Mutation Rate 0.04%
a. Total generations: 252
b. Drawing of the best tour found
c. Plot of the length of the best and worst tour at each
generation (gives the range of fitness values for each
generation).

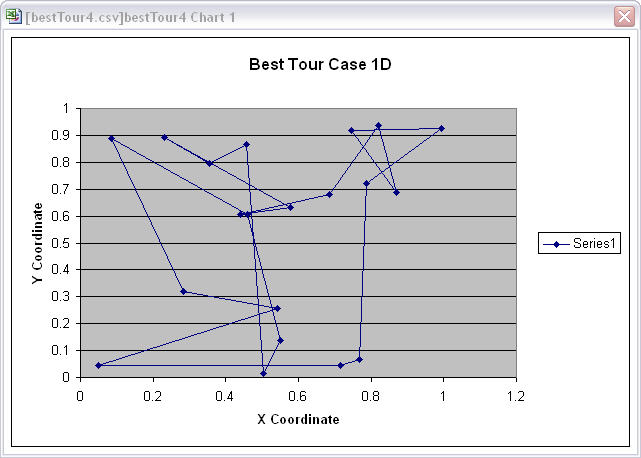
Case 1: Order Method and Mutation Rate 0.06%
a. Total generations: 247
b. Drawing of the best tour found
c. Plot of the length of the best and worst tour at each
generation (gives the range of fitness values for each
generation).

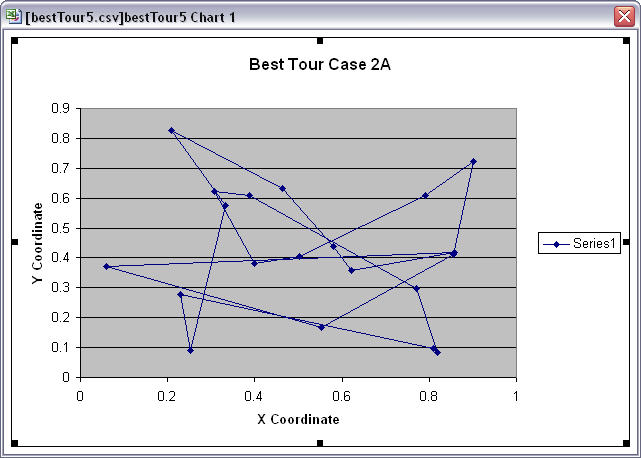
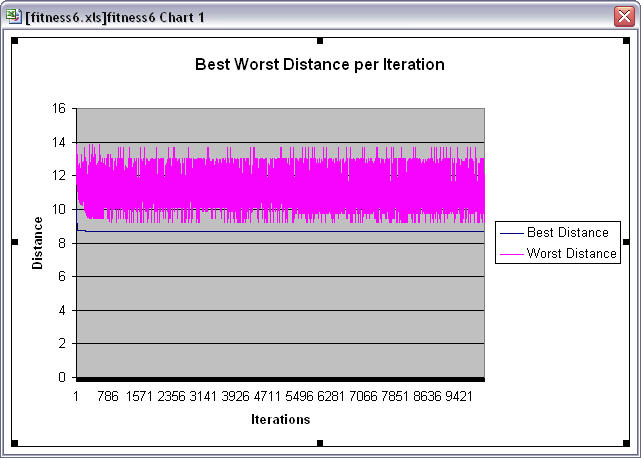
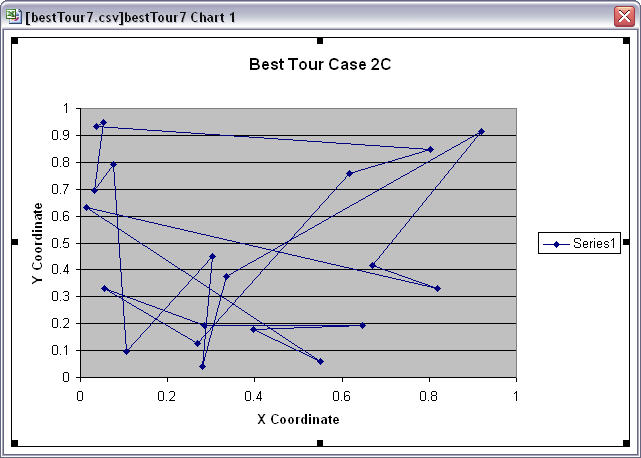
3. Case 2: Distance Method and Mutation Rate 0.00%
a. Total generations: 9999
b. Drawing of the best tour found
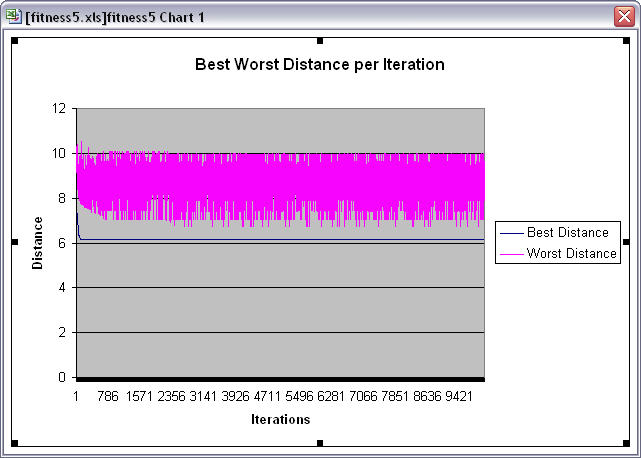
c. Plot of the length of the best and worst tour at each
generation (gives the range of fitness values for each
generation).
d. What do you think is the "best" mutation rate for this
problem? Explain.
The "best" mutation rate will probably be 0.06 because the higher the mutation rate the
higher the chance to find the optimal tour. However, this also means that the time of the
simulation will be longer.
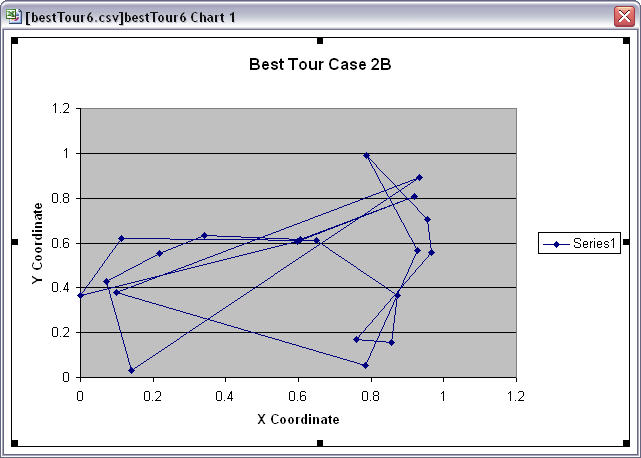
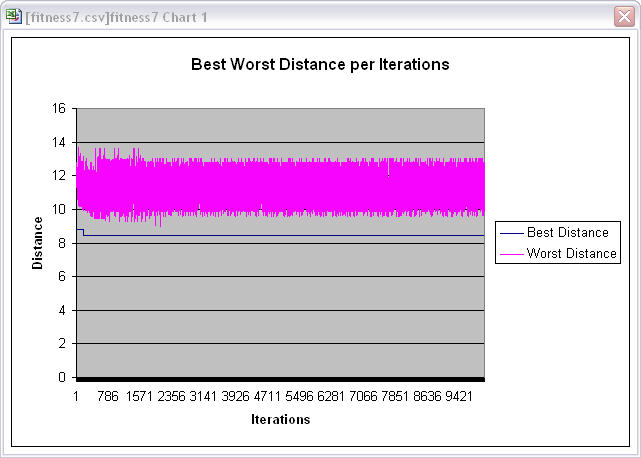
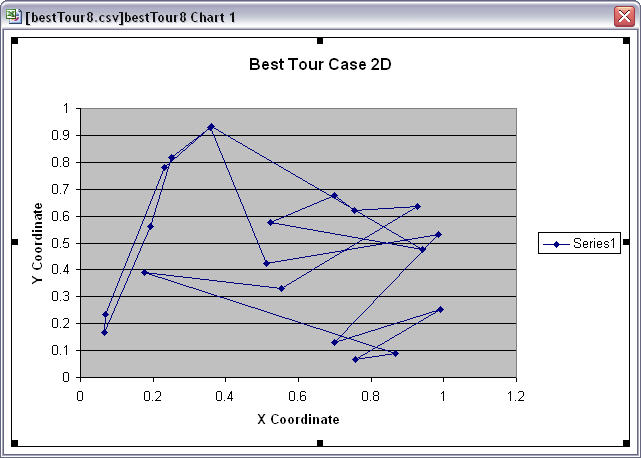
3. Case 2: Distance Method and Mutation Rate 0.02%
a. Total generations: 9999
b. Drawing of the best tour found
c. Plot of the length of the best and worst tour at each
generation (gives the range of fitness values for each
generation).
3. Case 2: Distance Method and Mutation Rate 0.04%
a. Total generations: 9999
b. Drawing of the best tour found
c. Plot of the length of the best and worst tour at each
generation (gives the range of fitness values for each
generation).
3. Case 2: Distance Method and Mutation Rate 0.06%
a. Total generations: 9999
b. Drawing of the best tour found
c. Plot of the length of the best and worst tour at each
generation (gives the range of fitness values for each
generation).