TI-73
HELP PAGE
Note: This
help page is intended to SUPPLEMENT the program's manual and/or Help menu.
Note: There
are a lot of graphics on this page, so it may take a little while to load.
Thanks for your patience.
This page will show you how
to do each of the following on the TI-73 graphing calculator, step by step.
CLEARING
THE HOME SCREEN:
-
While in the Home screen, simply
press

[Top of Page]
RETURNING
TO THE HOME SCREEN:
-
Press
 ,
[QUIT]
,
[QUIT]
[Top of Page]
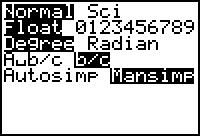
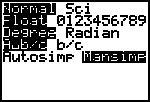
SETTING
THE MODE TO MANUALLY SIMPLIFY FRACTIONS:
-
Press

-
Use the arrows to move down and
over to Mansimp
-
Press

|
 |
[Top of Page]
SETTING
THE MODE TO DISPLAY ALL FRACTIONS IN THE FORM B/C:
-
Press
-
Use the arrows to move down and
over to b/c
-
Press
|
|
[Top of Page]
SETTING
THE MODE TO DISPLAY ALL FRACTIONS IN THE FORM A B/C:
-
Press
-
Use the arrows to move down and
over to A b/c
-
Press
|
 |
[Top of Page]
SETTING
THE MODE TO FLOAT:
-
Press
-
Use the arrows to move down to
Float
-
Press
|
|
[Top of Page]
ENTERING
EXPONENTS:
-
Type in base
-
Press

-
Type in exponent
[Top of Page]
ENTERING
A FRACTION:
-
Type in the numerator
-
Press

-
Type in the denominator
-
Press
[Top of Page]
ENTERING
A MIXED NUMBER:
-
Type in the whole number
-
Press

-
Type in the numerator
-
Press
-
Type in the denominator
-
Press
[Top of Page]
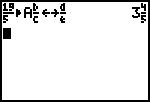
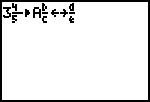
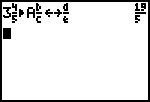
CONVERTING
BETWEEN AN IMPROPER FRACTION AND A MIXED NUMBER:
-
Type in an improper fraction (or
mixed number)
-
Press

-
Press
Improper Fraction to Mixed
Number: (if in
mode)
Mixed Number to Improper
Fraction: (if in  mode)
mode)
[Top of Page]
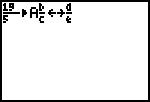
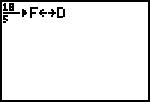
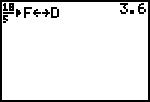
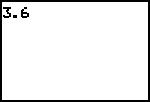
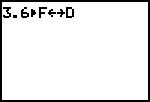
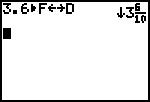
CONVERTING
BETWEEN A FRACTION AND A DECIMAL:
-
Type in a fraction (or decimal)
-
Press

-
Press
Fraction to Decimal:
Decimal to Fraction:
[Top of Page]
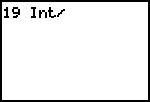
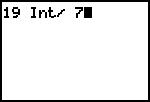
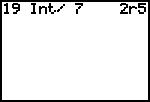
USING
THE INTEGER DIVIDE FUNCTION:
-
Type in the dividend
-
Press
[INT
 ]
]
-
Type in the divisor
-
Press
[Top of Page]
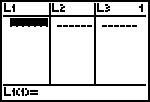
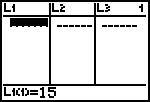
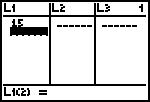
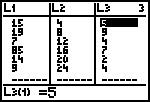
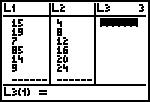
ENTERING
DATA INTO A LIST:
-
Press

-
Type in a data entry
-
Press
-
Repeat Steps 2 - 3 until all data
has been entered
[Top of Page]
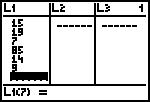
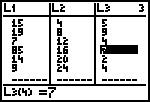
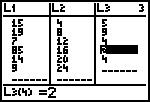
DELETING
A DATA ENTRY FROM A LIST:
-
Press
-
Move over to the desired list
-
Move down to the desired data
entry
-
Press

[Top of Page]
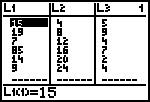
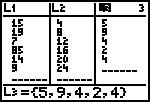
CLEARING
AN ENTIRE LIST:
-
Press
-
Move over to the desired list
-
Move up onto the list name
-
Press
-
Press
[Top of Page]
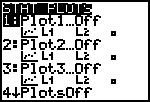
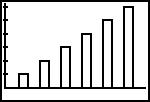
SETTING
UP A STAT PLOT: BAR GRAPH:
-
Enter all the data into (at least)
2 lists (See above for help.)
-
Press
[PLOT]
-
Select 1, 2 or 3
-
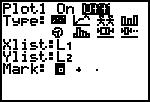
Move cursor on ON and press
-
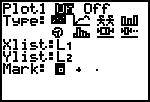
Move cursor down
-
Move cursor to the right on
 and press
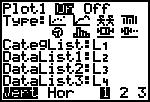
-
Move cursor down to CategList:
-
Enter the desired list for the
bar graph's category (If it is not already listed, then you will need to
press
[STAT] and select the desired list.)
-
Move cursor down to DataList1:
-
Enter the desired list for the
bar graph's data (If it is not already listed, then you will need to press
[STAT] and select the desired list.)
-
Repeat Step 10 if you want more
than one data list in the bar graph (DataList2: and/or DataList3:)
-
Move down to Vert Hor
-
Move cursor on Vert if
you want a vertical bar graph OR on Hor if you want a horizontal
bar graph, and press
-
Move cursor on 1 if you
have only one data list, on 2 if you have two data lists, OR 3
if you have 3 data lists
[Top of Page]
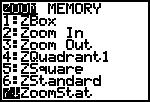
GRAPHING
A STAT PLOT:
-
Set up the Stat Plot (See
above for help.)
-
Press

-
Select 7:ZoomStat
. |
 |
[Top of Page]