�1998-2047 SMOD PUBLISHING
| Growth Charts These Charts are printable | |||||
|---|---|---|---|---|---|
| Girls birth-36months |
Preme-Girls birth-36months |
Girls 2-20years |
Boys birth-36months |
Preme-Boys birth-36months |
Boys 2-20years |
| Weight Charts These Charts are printable | |||||
| Girls birth-36months |
Preme-Girls birth-36months |
Girls 2-20years |
Boys birth-36months | Preme-Boys birth-36months |
Boys 2-20years |
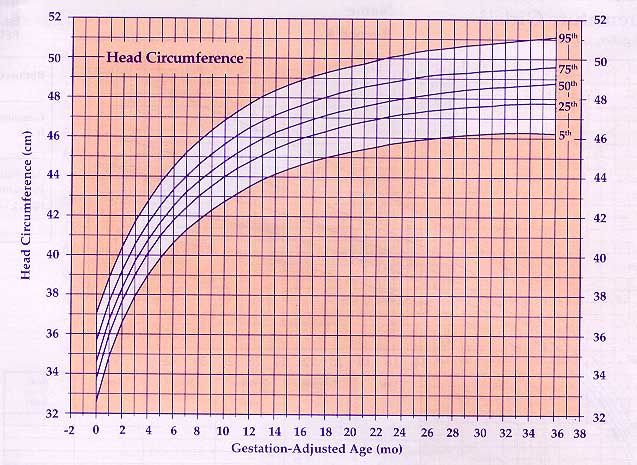
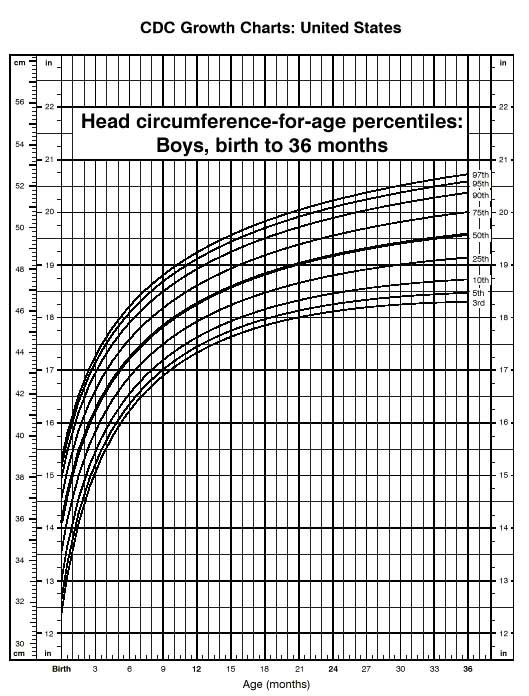
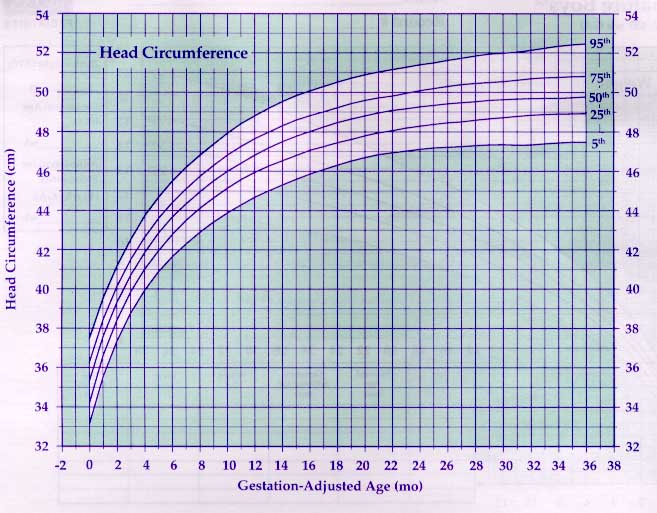
| Head Circumference Charts These Charts are printable | |||||
|---|---|---|---|---|---|
| Girls birth-36months |
Preme-Girls birth-36months |
Boys birth-36months |
Preme-Boys birth-36months |
||
| DOWN SYNDROME Height Charts | |||||
| Girls birth-36months |
Girls 2-18years |
Boys birth-36months |
Boys 2-20years |
||
| Weight Charts | |||||
| Girls birth-36months |
Girls 2-20years |
Boys birth-36months |
Boys 2-20years |
||
| Growth Chart for Children with Turner Syndrome Turner's Syndrome is a rare chromosomal disorder of females occuring once in 2500 births characterized by short stature and the lack of sexual development at puberty. Other physical features may include a webbed neck, heart defects, kidney abnormalities, and/or various other malformations. Normally, females have two X chromosomes. In cases of Turner's Syndrome, however, one X chromosome is missing from the cells (45,X). Although the exact cause of Turner's Syndrome is not known, it is believed that the disorder may result from an error during the division (meiosis) of a parent's sex cells. | |||||
| DISCLAIMER: As a reminder, this information should not be relied on as medical advice and is not intended to replace the advice of your child�s pediatrician. | |||||
The birth of a new baby is greeted by many questions from parents, relatives and friends. "Is the baby okay?" "Does the baby have all its fingers and toes?" The next most common questions are about the infant�s size - "how much did the baby weigh and what is the length?" These important values are then carefully recorded in the infant�s "baby book," written on birth announcements, and given out to grandparents, relatives and friends.
Parents really have the right idea here. These measurements will become a good indicator of the baby�s overall health, especially during the first three years. Physicians too are well aware of this close relationship. Infants who are well nourished nutritionally, receive emotional bonding from their parents, and have not developed a chronic medical problem will grow following a regular pattern.
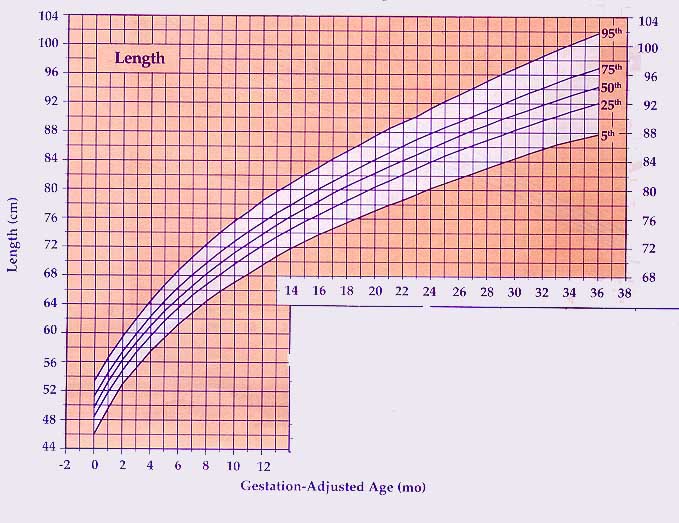
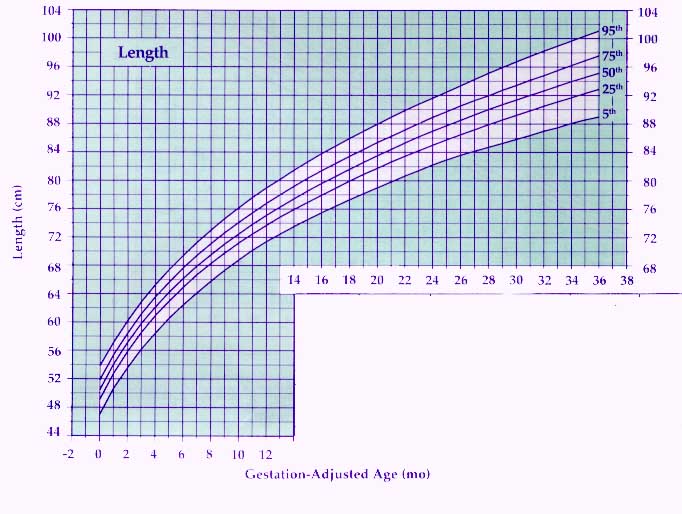
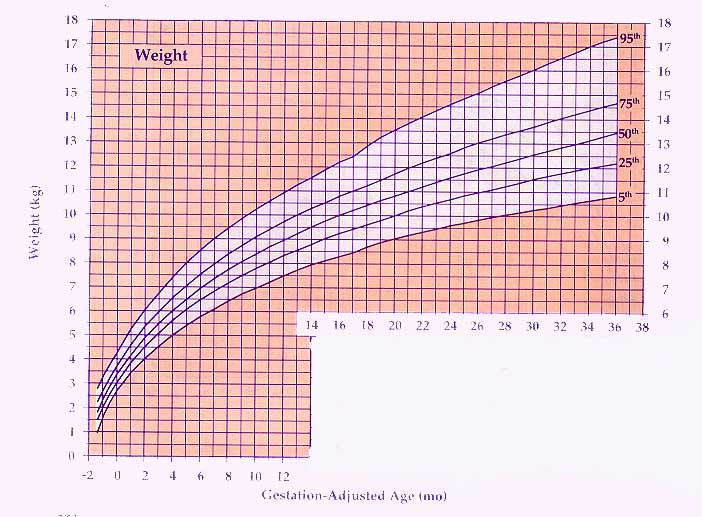
Pediatricians and family physicians use a growth chart to keep track of a child�s progress. As all of us realize, there is a wide variation in the height and weight of "normal" children. Growth charts were developed from information obtained by measuring and weighing thousands of children. From these numbers the national average for weight and height for each age and sex were established and plotted forming a curved line. This became the 50th percentile curve, meaning in a sample of 1,000 boys or girls, 500 would be above the curve and 500 would be below. Then other curves were established representing the 10th, 25th, 75th, and 90th percentiles. By definition, 100 out of one thousand normal children will be at the 10th percentile. Another way of looking at it is that a child whose height fell on the 10th percentile would be taller than 100 and shorter than 900 children of the same age and sex. Four separate charts are published by the National Center for Health Statistics: boys, birth to 36 months and 3 to 18 years of age, and girls, birth to 36 months, and 3 to 18 years of age. Growth charts are adjusted for babies born prematurely and babies who are small-for-dates at birth.
Parents often focus their attention on where a child�s growth is plotted on the chart. This may be particularly concerning to a parent if the measurement falls below the 50th percentile. Does this mean that their daughter will not make the dean�s list or their son will be too short to play basketball? Absolutely not! As long as the child is consistently in the normal range (between the 10th and 90th percentile) and stays in that range on multiple well child visits, everything is fine. Physicians become concerned when the child repeatedly falls below the lower limits for weight or height, or above the upper limits for weight. What is important is that the child gets on a steady percentile line and stays there. For example, a physician might worry if at a six-month-old baby was in the 75th percentile and at nine months was in the 25th percentile and then at 16 months was below the 10th percentile.
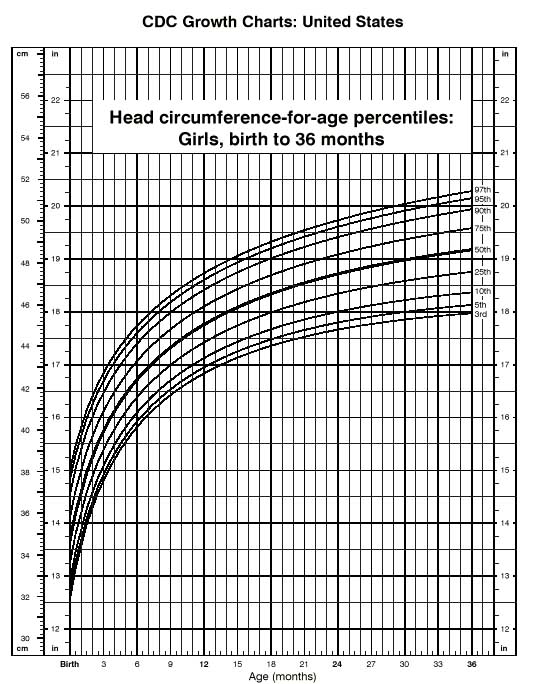
Another measurement performed during well checkups is the head circumference. Like height and weight, head circumference is carefully recorded and plotted on its own chart. Pediatricians become concerned when the head is growing too slowly or too quickly on repeated measurements. This measurement is also adjusted for babies born prematurely.
It is important to emphasize again that parents not focus their attention on an isolated entry in their youngster�s growth chart. Measurement errors do occur - the squirming infant on a baby scale may be difficult to weigh, a toddler recovering from a bout of diarrhea may seem to have dropped weight percentiles, or the slouching adolescent being measured during a sports physical. The growth trends over successive visits are more accurate and provide parents and physicians with important information about a child�s health.
The growth charts on our site are the latest pediatric growth charts issued by the Center for Disease Control (May, 2000). These updated charts are more representative of the U.S. Population and will be used by pediatricians, nurses, and nutritionists to monitor children�s growth.