Evidence for oculomotor memory for both saccades and central fixation from an imagery study
DINU-STEFAN TEODORESCU
University of Tromsø
Two different oculomotor
patterns were investigated in connection with visual perception and imagery in
eight participants, divided into two experimental groups, Free Vision (foveatic
vision) and Central Fixation (peripheral vision). The same oculomotor activity
pattern was observed during the visual perception task and during the imagery
task. The accuracy for visual memory also appeared to be evenly distributed
between the two groups,. These findings
suggest that oculomotor encoding is an integral part of our mechanisms of
visual perception.
Key words: oculomotor proprioception, saccades, fixations,
imagery.
INTRODUCTION
Several theorists have proposed that oculomotor proprioception is used by the visual system for encoding visual information (Buisseret, 1995; Bridgeman & Stark , 1991; Steinbach,1986, 1987; Velay et al., 1994; Gauthier et al., 1990; Graves et al., 1987; O’Keefe & Berkley, 1991; Roll et al.,1991). Two major theories, the inflow theory proposed by Sherrington and the outflow theory proposed by Helmholtz have hypotesized two different roles for the oculomotor inputs. The inflow theory maintains that eye position information is encoded by the central nervous system using input from the stretch receptors located in the extraocular muscles. The outflow theory, which is possibly more widely accepted, proposes that the conscious intent to move the eyes is monitored and translated into eye coordinates. Inflow could be used as a source of extraretinal eye position information, which can be remembered independently of proprioceptive information (Skavenski, 1972). However, retinotopic encoding of the visual world may not be sufficient for perceiving real motion in the real world, and other spatial frames of reference (e.g., craniotopic one) may also be used by the visual system. In this perspective, afferent input or sensory information is encoded also into a set of efferent systems or readiness systems so as that their combination leads to a more efficiently guidance of subsequent motor activity (Coren, 1986).
Hebb proposed an inherent oculomotor component in visual perception and visual imagery, claiming that if imagery is the reinstatement of a perceptual process, then this process should include eye movements. Hence, on this account, oculomotor patterns in imagery are not irrelevant, but essential (Hebb, 1968). When we visually explore our environment, our eyes fixate an object for a brief period (around 500 msec) before jumping to a new position (typically 12º-15º) in the visual field. These rapid eye movements are called saccades. Thus, saccades are quick, jerky movements of the eyes that optimise both foveal and peripheral vision for the extraction of visual information. Saccades can be reflexive, triggered externally by visual objects appearing suddenly (reflexive visually guided saccades), or intentional, triggered internally to a visual object already present for a period of time (intentional visually guided saccade), or perceived a moment before (memory-guided saccade), and expected at a specific location (predictive saccade) (Luer et al.,1988).
Studies on saccades [b1]have differentiated between target-driven saccades and memory–driven saccades, and this studies have clarified that these different types of saccades are mediated by different brain structures (Zivotofski et al., 1996; Gnadt et al., 1991; Xing & Andersen, 2000; Hikosaka et al., 2000; Gaymard et al., 1993; 1990; Perry, & Zeki, 2000; Sweeney et al., 1998; Luna et al., 1998; Petit et al., 1997). Differentiation between saccades and fixations has been also made on the basis of the different brain areas that are activated during active visual perception (Findley & Walker, 1999; Hikosaka & Wurtz, 1983; Schlag et al., 1992).
The neurophysiology of eye position encoding and control
The neurophysiology of predicted saccades
Target-driven saccades could use either retinal or spatial coordinates, while memory-driven saccades use perceptual coordinates (Wong & Mack, 1981). Studies of compensation for retinal error have found that in order to direct the eyes to a certain position in the orbit or in space, saccades are coded spatially rather than retinocentrically (Mays & Sparks, 1980). Saccades to remembered targets are planned in a craniotopic frame of reference by combining retinal input with eye position signal (Allin et al.1996). Saccades are mediated by “movement cells” located in the superior colliculus, caudal to fixation cells. These cells help the eyes to move on the basis of their relative activity (Munoz & Istvan, 1998). Pathways involved in visually guided saccade generation have been identified from studies of primates and humans. The direct parieto-tectal pathway which starts in the visual cortex is directed to the parietal eye field, from here further to connect with the frontal eye fields, reaching the internal capsule through the anterior limb (Gaymard, 1998).
For the generation of memory-guided saccades another pathway has been identified which starts in the visual cortex and reaches the parietal eye field, where it may constitute a spatial master map of the visual field. When this information also reaches the dorsolateral prefrontal cortex spatial information can be also stored in working memory. An oculomotor signal is likely to be stored in a cortico-subcortical oculomotor loop. Area 46 in the prefrontal cortex has been also implicated in the control of memory-driven saccades (Funahashi, 1989). Evidence from lesions studies suggests that memory-guided saccades are impaired after cortical lesions, but unaffected after lesions of the parieto-tectal pathway (Gaymard et al., 1990).
The neurophysiology of centered eye fixations
Keeping the eyes in a fixed position may require the activity of the so called “fixation cells”. These have been identified in the rostral poles of the superior colliculi (Munoz & Istvan, 1998). Rostral pole neurons are active during fixation even in the dark. Neurons, which discharge during attentive gaze, have been described in the frontal eye fields (Bruce & Goldenberg, 1985) and the posterior parietal cortex (Robinson, 1978). These neurons require attentive fixation, and clearly differ from neurons in the same regions which passively record eye position (Sakata et al., 1980). ). Sustained voluntary fixation is likely to be mediated by prefrontal cortex. Anderson (1994) observed an increased activity during central fixations in comparison with saccades in a zone of predominantly left ventromedial frontal lobe extending from area 11 ventrally to area 10 and 32 dorsally, including the anterior pole of the cingulated. Damage to these areas or either to a zone of left ventrolateral frontal lobe, encompassing lateral 9 and 10, anterolateral 8 and inclusive of area 45 and 46 may result in impaired fixation ability (Paus et al., 1991).
Hypothesis and predictions
Two groups participated in the experiment; the first group tested in a condition labelled hereafter “Free Vision” and the second group tested in a condition labelled “Central Fixation”. Subjects in the “Free Vision” group were allowed to scan freely the picture shown on the screen showing pictures of tropical fish. It was hypothesized that they would normally foveate the stimuli (i.e., the fish) and on the basis of these free scannpaths they would encode properties of the visual stimuli in long-term memory (e.g., the fish’ global shape, the shape of its parts, colours, etc.). In contrast, subjects in the “Central Fixation” group were requested to fixate a point in the middle of the monitor during the perception task and therefore encode through peripheral vision the same visual stimuli seen freely by the previous group. [b2]In order to test the importance of encoding the gaze along with the visual information, two different encoding strategies were used, and it was expected to see at retrieval from the long-term memory, when constructing a visual image of the pattern, the same oculomotor patterns.
Therefore, the specific hypotheses for this study were:
If the oculomotor information is encoded together with the visual information in the visual perception task, then in the imagery task, the same pattern of oculomotor activity should be present. Specifically: 1) the Free Vision group will show scannpaths towards and over the stimulus’ area during both the perception and imagery task. 2) the Central Fixation group will keep the gaze on the same central fixation spot during the perception, as required, but they will also do the same spontaneously during the imagery task.
METHODS
Participants
Eight students at the University of Tromsø, five females and three males, volunteered to participate as paid participants in this experiment, which was conducted in the “cognitive neuropsychological laboratory” at the Department of Psychology, Tromsø. All participants reported having normal or corrected to normal vision (with contact lenses) and their age range was 21-44. Participants were told that the experiment investigated eye movements in mental imagery. None of the subjects had specific knowledge of the tropical fish species shown as stimuli. The participants were assigned randomly to the two experimental groups.
Apparatus
and Materials
Eye movements were recorded by means of a remote eye-tracking device using infrared light. The Remote Eye Tracking Device, R.E.D.-I., built by SMI-SensoMotoric Instruments from Teltow-Germany, uses iView-software. The R.E.D.-II, can operate at a distance of 0,5-1,5m, and the recording eye sample rate is 50/60Hz., and the resolution is better than 0,1 degree. The eye-tracking device is operating by determining the positions of two elements of the eye: the center of the pupil and the center of the corneal reflection. The sensor, a video camera views one eye of the participant using infrared light and the video signal is processed to extract the features of interest: the center of the pupil and the center of the corneal reflection. The coordinates of all the boundary points are fed to a computer that, in turn, determines the centroids of the two elements. The vectorial difference between the two centroids is the “raw” computed eye position. There was white electric light in the room during the experiment, which was not interfering with the recordings capabilities of the apparatus. A visual memory questionnaire made of twenty-two questions were prepared in order to test the accuracy of the visual memory of the participants, using simple questions about, shape, color, direction which required simple answers of one or two short words. Here is an example of a question from the memory questionnaire: Question: ” How many black stripes had the fish?” Answer: “Two”.
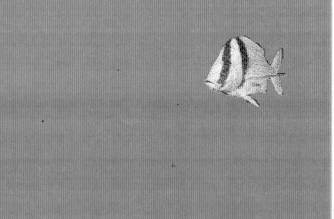
Stimuli
The images used as stimuli were color photographs of tropical fish from a fishing guide, all of the same size, 2x3 cm, covering an area of 2º of the visual field. The stimuli were first digitized by use of an Agfa scanner and images were edited and formatted by use of Adobe Photoshop software. Each stimulus was presented on a flat screen color monitor with a diameter of 49 cm, each fish shape appeared 10º from the center, in one of the four corners of the screen. In the middle of the screen there was a white fixation point covering 0,5º. The color of the screen was blue, which gave somewhat the impression of observing a fish swimming in the ocean. The stimuli presentation was done using software ACDSee 32v2.4. The blank screen used in the imagery phase had the same blue background color.
Figure 1. Stimulus
prototype
Procedures
Procedures
The participants were randomly divided between two experimental groups, the Free Vision and the Central Fixation, four subjects in each group. Before the experiment, each participant was asked to read and sign a consent form for participating in the experiment and to read the general instructions common to all groups as well as the specific instructions for their specific group. The experiment comprised two tasks: A perception task, and an imagery task. The instructions for the Free Vision group for the perception task were:
“ Look carefully at the fish that shall appear on the monitor and try to remember it as accurately as possible.” The instructions for the Central Fixation group in the perception task were: “ Look, and keep your eyes focused on the cross in the middle of the monitor, and try to remember everything that is presented on the monitor.” The instructions for the imagery task were common for all groups: “ Try to imagine what you just saw earlier, while keeping the eyes open”. There was no instruction regarding gaze and fixations in the imagery task. The eye movements were recorded both in the perception and imagery tasks and for an equal length of time (i.e., 15").
The experimental protocol
After reading the experiment’s instructions, each participant was seated comfortably on a chair with the head placed in a chin-and-forehead rest apparatus, centered 50cm away from the monitor. The chin-and-forehead rest apparatus was used in order to reduce head movements. At the beginning of the experiment, the apparatus was calibrated, by asking the participant to move the gaze on nine standard positions on the monitor. After the last trial, a recording was taken of each subject’s eye fixations to the same 9 locations used in the initial calibration phase in order to confirm the precision of the eye recordings during each participant’s performance. One subject’s data were rejected due to imprecise recording and substituted with a new subject.
After the calibration of the apparatus, the experimental session started immediately. The experiment consisted of two practice trials and twenty experimental trials. Each trial consisted of the following sequence of events: 1) a fish appeared, following a semi-random order, in one of the corners of the monitor while a white cross of 0,5º appeared in the middle. This scene was viewed by the subject for a duration of 15"; 2) a blank blue screen was then presented on the monitor. The participant was asked to image what s/he just saw, while keeping the eyes open; 3) the participant indicated that s/he had constructed or generated the image, and at that point the experimenter asked a question about a the detail of the fish; 4) the participant answered the question while still holding the image in mind; 5) after the elapsed 15” the next stimulus was presented.
Figure 2. Diagram of the experimental procedure.
Imagery field
Perception field
Calibration and eye movement analysis
Before and after each experimental session a calibration routine was performed by using nine calibration points (a plus sign). Specifically, calibration point occupied a matrix of 3x3 points, each 10º apart, while the viewing distance was 50 cm. The participant was instructed to fixate each location, which was sampled at a rate of 1000Hz for 100msec near the middle of this interval. These recordings served to calibrate the output of the eye-tracker device against spatial position, and to analyse the eye movement trajectories for fixation points and sequence of fixation points. Calibrations showed no changes in the head position during the experimental trail, and the quality of the recorded data was thus not affected. The calibration procedure was repeated again at the end of the experiment for each participant.
Design
A 2 (gaze condition: free vision/central fixation) x 2 (visual task: perception/imagery) x 5 (“Quadrants”; upper left, upper right, lower left, lower right, and centre) design was used. The 5 quadrants corresponded to 5 separate regions within the monitor’s area and corresponded to separate and equally large square regions of the monitor (see Figure 3).
Figure 3. Regions of sampling of time of fixation
UPPER RIGHT LEFT
UPPER

CENTRE
LOWER RIGHT LOWER LEFT
Data analysis
The percentage of fixation spent on each of the five different locations (4 for the stimuli presentation and one corresponding to fixation) was used as the dependent variable. Separate simple regressions were performed on the percentage of fixation for the same regions of the monitor between the perception and imagery task and for each experimental condition (free vision/fixation). A probability level of 0.5 was used as the significance cut-off level for all statistical analyses.
Results
Relationship between perception and imagery
for all groups
For
each participant the eye movement rate (EMR) was calculated for the viewing and
imaging tasks. The EMR is defined as the percentage of time, spent on each
defined region (quadrants, N=5). Two simple regression analyses were performed
between the percent of time spent in each quadrant in the perception condition
(the regressor) and in the imagery condition (the dependent variable), in order
to assess whether the variables of perception and imagery are related. The
regression analysis for the Free Vision and Central Fixation conditions showed
a clear linear relationship between EMRs in the perception task and in the
imagery task (slope coefficient = 0.9, t (798)=78.2, p<0.0001; R-squared =
0,9). The regression plot is shown in Figure 4.
Figure 4.Linear regression of
EMRs for all conditions in the perception and imagery tasks.
Relationship between perception and imagery in the Free Vision group
First of all, it was of particular interest to see whether there was a relationship between EMRs in perception and imagery in the Free Vision group. Thus, a regression analysis was performed on all the data of subjects who participated in the Free Vision condition. This showed a clear relationship between EMRs in the perception task and in the imagery task (slope coefficient = 0.9, t(398)=31.8, p<0.0001; R-squared = 0.7).The regression plot is shown in the Figure 5.
Figure 5.Free Vision: Linear
regression of EMRs for perception and imagery tasks

In order to quantify more clearly the relationship between EMRs in the perception and imagery task, we also performed an additional regression analysis, this time excluding from the data sample all fixations to the quadrant corresponding to the central fixation,. Including these data may have artifactually increased the slope of the regression line between perception and imagery. Instead focusing on just the fixation data to the quadrants corresponding to the stimuli locations would yield a better picture of the relation between eye movements in the two conditions. The regression analysis showed an even clearer linear relationship between EMRs in the perception task and in the imagery task (slope coefficient = 0.9, t(318)=30.1; R-squared = 0,7). The regression plot is shown in Figure 6.
Figure 6.Free Vision: Linear
regression of EMRs(center quadrate excluded) for perception and imagery tasks.
Relationship between perception and imagery in the Central Fixation group
In addition, we were interested to see whether there was a relationship between EMRs in perception and imagery the Central Fixation group. The regression analysis for the Central Fixation condition showed a clear relationship between EMRs in the perception task and in the imagery task (slope coefficient = 0.9, t(398)=93.5, p<0.0001; R-squared = 0.9).The regression plot is shown in the Figure 6.
Figure 6.Central Fixation: Linear regression of EMRs for perception and imagery tasks
In this case, an additional regression analysis was performed on the fixations to the central quadrant only, thus excluding fixations to the 4 peripheral quadrants corresponding to stimuli locations (which were not targeted in this subjects’ group, according to instructions, during the perceptual task). The regression analysis showed a clear linear relationship between EMRs in the perception task and in the imagery task (slope coefficient = 0.8, t(78)=14.7; R-squared = 0,7). The regression plot is shown in Figure 7.
Figure 6. Central Fixation:
Linear regression of EMRs(the four peripheral quadrants excluded) for
perception and imagery tasks.

In Table 1. are presented means and standard deviations for EMR times across the 5 regions for all the groups during the perception and imagery tasks. Region 1 is the centre quadrant, region 2 is the lower left quadrant, region 3 is the lower right quadrant, region 4 is the upper left quadrant and region 5 is the upper right quadrant.
Table 1. Means and standard
deviations for EMRs times across the 5 quadrants for the two groups in
perception and imagery tasks.
|
Region |
Imagery task |
|||||||
|
Free Vision |
Central Fixation |
Free Vision |
Central Fixation |
|||||
|
|
MEAN |
SD |
MEAN |
SD |
MEAN |
SD |
MEAN |
SD |
|
1 |
5.8 |
8.9 |
139.3 |
45.1 |
3.1 |
12.7 |
125.7 |
44.4 |
|
2 |
21.7 |
33.3 |
0.3 |
1.0 |
22.5 |
36.0 |
0.9 |
4.6 |
|
3 |
14.1 |
26.1 |
0.1 |
0.4 |
13.7 |
26.9 |
1.2 |
4.7 |
|
4 |
39.2 |
51.2 |
0.9 |
0.5 |
34.6 |
52.4 |
2.3 |
7.6 |
|
5 |
18.4 |
31.7 |
0.0 |
0.0 |
14.9 |
29.7 |
0.4 |
1.7 |
Note. The values represent the percentage of time spent in the five quadrants by the two groups in the two experimental conditions.
In Table 2 are shown means and standard deviations for EMR times for the two groups in perception and imagery tasks.
Table2. Means and standard
deviations for EMR times for the two groups in perception and imagery tasks.
|
Group |
Perception |
Imagery |
||
|
MEAN |
SD |
MEAN |
SD |
|
|
Free Vision |
19.8 |
34.8 |
17.8 |
35.5 |
|
Central Fixation |
27.9 |
59.3 |
26.2 |
53.8 |
Note. The values represent percentages of time spent by the two groups in the two conditions.
In Figure 8 are illustrated the EMR recordings from the two conditions during both perception and imagery.
Figure 8.EMR recordings from the
two conditions during both perception and imagery
Perception – Free vision Imagery – Free vision


Perception – Fixation Imagery – Fixation


DISCUSSION
The aim of the present study was to investigate whether oculomotor information encoded together with the visual information is re-enacted at retrieval of the visual information. We manipulated visual encoding by controlling the direction of gaze and consequently whether the subjects, used foveal vision or peripheral vision. Specifically, in one condition the participants were allowed to make eye movements freely whereas in the other condition they were not. A few previous studies have already indicated the importance of eye movements in imagery (Ruggieri, 1999). The main hypothesis was that if oculomotor information is encoded during the visual perception task, the same pattern of oculomotor activity should also be present at retrieval of the visual information. The results showed a nearly identical pattern of oculomotor activity between the perception and imagery condition of both two groups. Foveal gaze may allow the encoding of visual stimuli, differently from peripheral gaze, considering that in the visual cortex there is a greater area devoted to foveal vision than to peripheral vision.
The second hypothesis of the study focussed on the foveal encoding of visual information, proposing that the same oculomotor activity should be used at encoding and at retrieval of the visual information. According to the results, clearly the scannpaths occurred on the same region of space at the retrieval as at they occurred during the encoding phase of the visual shape. If it is correct to think that the retrieval of patterns is a “reconstruction” of the original visual image as encoded during oculomotor activity, then according to Hebb, oculomotor activity will become a necessary aspect of the retrieval component and actually assist the operation of recombining together the pieces of information encoded in several and different areas of the brain.
Findley and Walker (1999) proposed a “5-levels” of processing model of the oculomotor information, also proposing a difference between conscious and unconscious processes. Oculomotor activity at the first level is the motor command (immediate pre-motor stage) and it is unconscious, so that we may not be aware of the encoding of the eye movements, which are instead controlled by higher hierarchies (i.e. level 5), which are conscious. From level 5 we might impose conscious control on the oculomotor program at encoding, so that it is possible to encode visual information without foveal gaze, via peripheral gaze, which could also make no use of eye movements.
Indeed, the third hypothesis was focussed on the aspect of peripheral gaze encoding of visual information in concomitance with making no use of oculomotor activity (by requiring fixation). The hypothesis implied that no oculomotor activity should be present at retrieval of the visual information, if no eye movements were used at encoding. Indeed, the results showed no eye activity present at retrieval. A few sporadic spontaneous movements of the eyes were observed, but these movements might have been due to involuntary neck or head movements.
One of the basic inferences from this study is that
the visual information is encoded together with oculomotor information and
stored in long-term memory. There is now good physiological evidence from
studies on memory that have identified inferotemporal cortex memory cells
organized in broad networks that fire complex spike sequences (Fuster, 1995)
which are combinations of three or four spikes separated by precisely the same
two or three intervals. Because some of these cells show many of the patterns
with long intervals (several hundred milliseconds long) it is reasonable to
infer that the cells are part of wide networks, possibly extending far from
inferotemporal cortex (e.g. into
prefrontal cortex) and encoding several attributes (e.g. motor associations) of
a visual memory. Posterior parietal cortex would seem essential for encoding
visuaospatial information, whereas prefrontal cortex could subserve the
temporal organization of visuomotor behavior. Moreover, area 7 of the posterior
parietal cortex could have spatial integrative functions. Many area 7 units are
tuned to movements of eyes and arm toward specific positions in surrounding
space. Some are activated by ocular fixation and others by the tracking of
visual targets (Mountcastle et al., 1975). The role for the cells of the
area 7 in the lateral intraparietal cortex seems to integrate signals from
sensory receptors with motor actions of eyes and limbs; there is now good
evidence that area 7 neurons participate in memory networks (Andersen, 1990;
Xing & Andersen, 2000).
Norton & Stark (1971) originally
proposed a theory, called the scannpath theory to account for the apparent
reenactment of the scannpaths at retrieval that were used originally at encoding.
Consistent with Norton & Stark (1971), the findings presented here support
a model of visual perception, which makes use of oculomotor proprioception in
encoding and retrieval of the visual world.
References
Allin, F., Velay, J. L., & Bonquerel, L. (1996). Shift in saccadic direction induced in humans by proprioceptive manipulation: a comparison between memory-guided and visually guided saccades. Experimental Brain Research, Vol. 110, No. 3, 473-481.
Andersen, R. A., Bracewell, R.M.,
Barash, S., Gnadt, J. W., & Fogassi, L. (1990). Eye
position effects on visual , memory , and saccade-related activity in area LIP
and 7a of macaque. Journal of Neuroscience 10, 1176-1196.
Anderson, T.J., Jenkins, H.I.,
Brooks, D. J., Hawken, M. B., Frackowiak, R.S. J., &
Kennard, C.
( 1994). Cortical control of saccades and fixation in man – a PET study. Brain,
117, 1073-1084.
Bridgeman, B., & Stark, L.
(1991). Ocular proprioception and efference copy in
registering
visual direction. Vision Research, Vol.31, No.11, 1903-1913.
Bruce, C. J., &
Goldberg, M. E. (1985). Primate frontal eye fields. I. Single neurons
discharging before saccades. Journal of Neurophysiology, Vol. 53, No.
3, 603-635.
Buisseret, P. (1995).
Influence of extraocular muscle proprioception on vision. Physiological
Reviews, vol75, No. 2, 323-338.
Coren, S. (1986). An
efferent component in the visual perception of direction and extent. Psychological
Review, Vol.93, No.4, 391-410.
Findlay, J. M., & Walker, R.
(1999). A model of saccade generation based on parallel
processing
and competitive inhibition. Behavioral and Brain Sciences, 22, 661-721.
Funahashi, S., Bruce, C. J., & Goldman-Rakic P. S. (1989). Mnemonic
coding of
visual
space in the monkey’s dorsolateral prefrontal cortex. Journal of
Neurophysiology, Vol.
61, No.
2, 331-349.
Fuster, J. M.(1995). Memory in the cerebral cortex- an empirical approach to neural networks in the human and nonhuman primate. Cambridge, Mass.: The MIT Press.
Gauthier, G.M., Nommay, D., & Vercher, J-L. (1990). Ocular muscle proprioception and visual localization of targets in man. Brain, 113, 1857-1871.
Gaymard, B., Pierrot- Deseiligny,
C., & Rivaud, S. (1990). Impairment of sequences of memory-guided saccades
after supplementary motor area lesions. Annals of Neurology, Vol. 28, No. 5,
622-626.
Gaymard, B., Rivaud, S., &
Pierrot-Deseiligny, C. (1993). Role of the left and right supplementary motor areas in memory-guided
saccade sequences. Annals of Neurology, Vol.34, No.3, 404-406.
Gaymard, B., Ploner, C. J., Rivaud, S., Vermersch, A. I., & Pierrot-Deseiligny, C. (1998). Cortical control of saccades. Experimental Brain Research, 123, 159-163.
Graves, A.L., Trotter, Y., &
Fregnac, Y. (1987). Role
of the extraocular muscle proprioception in the development of depth perception
in cats. Journal of Neurophysiology, Vol. 58, No. 4, 816- 831.
Gnadt, J. W., Bracewell, R. M.,
& Andersen, R. A. (1991). Sensorimotor transformation during eye movements to remembered visual
targets. Vision Research, Vol. 31, No. 4, 693-715.
Groner,.R. (1988).Eye movements attention and visual information processing :some experimental results and methodological considerations.In Luer et al.,(1988).Eye movement research- physiological and psychological aspects.Toronto: C.J.Hogrefe.
Hebb, D. O. (1968). Concerning imagery. Psychological
Review, Vol. 75, No. 6, 466477.
Hikosaka, O., & Wurtz, R. H.
(1983). Visual and
oculomotor functions of monkey substantia nigra pars reticulata. II. Visual
responses related to fixation of gaze.Journal of Neurophysiology, Vol. 49,
No. 5 1254-1267.
Hikosaka, O., Takakiwa, Y., &
Kawagoe, R. (2000). Role of the basal ganglia in the eye control of purposive
saccadic eye movements. Physiological Reviews, Vol. 80, No. 3, 953-978.
Jakobson, L. S., & Goodale, M.
A. (1989). Trajectories of reaches to prismatically-displaced targets: evidence
for “automatic” visuomotor recalibration. Experimental Brain Research, 78, 575-587.
Jeannerod,M. (1986). Mechanisms of visuomotor coordination: a study in normal and brain-damaged subjects. Neuropsychologia, Vol.24, No.1, pp. 41-78.
Luna, B., Thulborn, K. R., Strojwas, M. H., McCurtain, B. J., Berman, R. A., Genovese, C. R., & Sweeney, J. A. (1998). Dorsal cortical regions subserving visually guided saccades in humans: an fMRI study. Cerebral Cortex, Vol. 8, 40-47.
Luer, G., Lass, L. & Shallo-
Hoffmann, J. ( Eds.)(1988). Eye movement research- psysiological and
psychological aspects. NY: C.J. Hogrefe.
Mays, L. E., & Sparks, D. L. (1980). Saccades are spatially, not retinocentrically , coded. Science, Vol. 208. 1163-1165.
Mon-Williams, M., & Tresilian, J. R. (1998). A framework for considering the role of afference and efference in the control and perception of ocular position. Biological Cybernetics, 79 , 175-189.
Mountcastle, V.B., Lynch, J.C., Georgopoulos,A., Sakata,H. and Acuma,C.(1975).Posterior parietal association cortex of the monkey: command functions for operations within extrapersonal space.Journal of Neurophysiology 38:871-908.
Munoz, D.P. & Istvan, P.J. (1998). Lateral inhibitory interactions in the intermediate layers of the monkey superior colliculus. Journal of Neurophysiology 79: 1193-209.
Noton, D., & Stark, L. (1971). Scanpaths in saccadic eye movements while viewing and recognizing patterns. Vision Research, Vol.11, 929-942.
O’Keefe, P. L., & Berkley, M.A. (1991). Binocular immobilization induced by paralysis of the extraocular muscles of one eye: evidence for an interocular proprioceptive mechanism. Journal of Neurophysiology, Vol. 66, No. 6, 2022-2033.
Paus, T., Kalina, M., Patockova, L.,
Angerova, Y., Cerny, R., Mecir, P., Bauer, J., & Krabec, P. (1991). Medial
vs lateral frontal lobe lesions and differential impairment of centra-lgaze
fixation maintenance in man. Brain, 114, 2051-2067.
Perry, R. J., & Zeki, S. (2000).
The neurology of saccades and covert shifts
in spatial attention: an event-related fMRI study. Brain, 123, (Pt
11), 2273-2288.
Petit,L., Clark,V.P. Ingeholm, J. and Haxby,J.V. (1997). Dissociation of saccade-related and pursuit related activation in human frontal eye fields as revealed by fMRI. Journal of Neurophysiology,Vol.77 No.6, 3386-3390.
Robinson, D. I., McClurkin, J. W., & Kertzman, C. (1990). Orbital position and eye movement influences on visual responses in the pulvinar nuclei of the behaving macaque. Experimental Brain Research, 82, 235-246.
Roll, R., Velay, J.L., & Roll, J.P. (1991). Eye and neck proprioceptive messages contribute to the spatial coding of retinal input in visually oriented activities. Experimental Brain Research,85, 423-431.
Ruggieri, V. (1999). The running horse stops: the hypothetical role of the eyes in imagery of movement. Perceptual and Motor Skills, Vol. 89, (3 Pt 2), 1088- 1092.
Sakata, H., Shibutani, H., & Kawano, K. (1980). Spatial properties of visual fixation neurons in posterior parietal association cortex in the monkey. Journal of Neurophysiology, Vol. 43, No. 6, 1654- 1672.
Schlag, J., Schlag-Rey, M., & Pigarev, I. (1992). Supplementary eye field: influence of eye position on neural signals of fixation. Experimental Brain Research, 90, 302-306.
Skavenski, A.A. (1972). Inflow as a source of extraretinal
eye position information. Vision Research, Vol.12, 221-229.
Steinbach, M. J. (1986). Inflow as a long-term calibrator of
eye position in humans. Acta Psychologica, 63, 297-306.
Steinbach, M. J. (1987).
Proprioceptive knowledge of eye position. Vision Research, 27,
1737-1744.
Sweeney, J. A., Luna, B., Strojwas,
M. H., & Thulborn, K. R. (1998). Mapping distinct cortical eye fields for
saccadic and pursuit eye movements in humans using fMRI. Social Neuroscience
Abstracts, 23, 2222.
Velay, J. L., Roll, R., Lennerstrand, G. & Roll, J.P. (1994). Eye proprioception and visual localization in humans: influence of ocular dominance and visual context. Vision Research, 34, 2169-2176.
Wong, E., & Mack, A. (1981). Saccadic programming and perceived location. Acta Psychologica, Vol.l, No. 48, 123-131.
Xing,J., & Andersen,R.A.(2000). Memory activity of LIP neurons for sequential eye
movements stimulated with neural networks.Journal of Neurophysiology Vo.84 No.2, pp.651-
665.
Zivotofsky, A.Z., Klaus, G.R., Averbuch-Heller, A., Kori, A.A., Thomas, C. W.,
Dell’osso, L. F., & Leigh, R. J. (1996). Saccades to remembered targets: the effects of smooth
pursuit and illusory stimulus motion. Journal of Neurophysiology, Vol.76, No. 6, 3617-3636.