
Stock Market Webquest

| Stock Market Webquest | |
|---|---|---|
Day one and two: Students learn the basics of the stock market
Day three: Students investigate the idea of a sector.
Students should pick one sector to report on in their Powerpoint Presentation.
Some Sector Examples
Technology
Healthcare
Retail
Service
Day four and five: Students will continue to research .
Day three and four:Student begin to select stocks for their portfolio
Day four: Students purchase their stocks , however
they will get historical data on daily stock price fluctutaoin from.
Day five:Students prepare excel spreadsheets to track their stock information
(daily price fluctuations)
Day six, seven, eight
Student should begin building their Powerpoint Presentation they are responsible
for the slides on a sector of their choice
Day nine
Student collect information using Microsoft Word.
Day ten and third week: PowerPoint with animations, pictures, sound, and company information.
Brochure made in Microsoft Publisher or Microsoft Word marketing a company of their choice to
potential investors.
Excel Spreadsheet with charts showing the overall performance of the fund, averages,
and median stock prices
Students should continue to track stock purchases.
Investigate and formulate questions from problem situations.
Represent situations verbally, numerically, graphically, geometrically, or symbolically.
Discuss, write, read and listen to mathematical ideas.
Reason with proportions,from graphs and inductively/deductively.
Create connections between math and other subjects and to the world outside the classroom.
Creating mathematical connections through applying mathematics.
Use statistical methods to describe, analyze, evaluate, and make decisions.
Using estimation both in solving problems and in checking the reasonableness of results.
Explore relationship among representations of, and operations on, whole numbers, fractions, decimals
integers, and rational numbers.
Developing an understanding of ratio, proportion, and percent.
1.
What
does a stock represent?
2. What is a disadvantage of owning stock?
3. How do you buy and sell stocks?
4.
Other than selling at a higher price, what is another way to make
money from stock holdings?
CLICK HERE FOR INFORMATION
5. How many votes do you get for each share of stock?
6. How do you determine if a stock is at a good price?
7. What is the P/E growth ratio?
8. You should buy stocks in a variety of industries � True/False
9. It is recommended to have a portfolio of 5-10 stocks - True/False
10. What are 2 factors to consider when identifying stocks?
11.
Where are two places you can go on the Internet
to research stocks?
CLICK HERE FOR INFORMATION
12.
What was the price for a share of Dell last Friday?
CLICK HERE FOR INFORMATION
Use collaboration skills in formal and informal groups.
Exceeds Expectations:
Approaches Expectations:
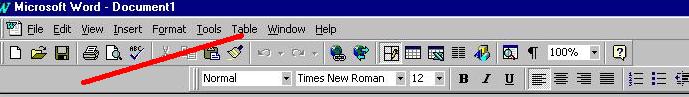
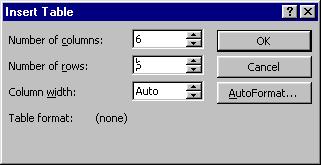
1. Click on the Table button on the standard toolbar.

SET TIMING
Click on Slide show/Slide Transitions
Check off the box to make the transitions automatic and enter the number
of seconds
You can apply it to one particular slide, or every slide in the show
(You may want to change the number of seconds for each slide)
ANIMATE SLIDE
Click on Slide show/Custom Animations
Choose the element that you want to animate (for example � title)
Click on Animate automatically and enter the number of seconds
Click on the tab to choose your animation � (for example � crawl from left)
Hit apply
ADD SOUND OR MOVIE
Insert/Movies and Sounds/from file
Find the file you want to add
Hit insert
Click on the sound or movie icon to select it
Hit Slide show/Custom Animation
Animate automatically after 0 seconds
Apply
Preview your file by hitting Slide Show/View Show
Requirement
|
Points |
|
|
Information is presented in a clear and organized manner |
0-20 |
|
Attention to audience�s level of knowledge, age, and interests |
0-20 |
|
Clear understanding of topic presented |
0-20 |
|
Students comments are timed to go along with the slides � Student is not reading directly from the slide, but embellishing his/her point with other comments |
0-20 |
|
Student uses anecdotes, examples, analogies, statistics and other evidence to support his/her buying and selling decisions |
0-20 |
Exceeds
Expectations:
Meets
Expectations:
Approaches
Expectations:
Does
Not Meet Expectations:
A total of 450 points is possible.
|
Task |
Explanation |
Points |
|
You should
have some justification for why you purchased each stock. (for example
� stock price is a bargain, you appreciate the quality of the company�s
products, you shop there, good customer service, past performance,
current trends, etc.) |
25 |
|
Have the amount you purchased your stocks for and the sales commission charge./TD> |
25 |
|
Track in an excel spreadsheet |
10 |
|
See example |
15 |
|
See examples Title the
charts and label the axis |
25 |
|
See sample
outline and requirement |
100 |
|
See presentation
rubric |
100 |
|
See rubric |
50 |
|
See collaboration
rubric |
100 |
Explain the five companies
you decided to invest in and why
Include a picture from the
company�s web site and some pertinent information from the companies website
Was
there a profit? How much did
you end up with? What will
be done differently in the future?
�
Include notes page for each
slide to supplement your presentation.
�
Use automatic transitions
� practice the timing along with your notes.
�
Use custom animation to embellish
your slide show.
�
Add sound to your slide show.
�
Be prepared to speak when
you give your presentation.
|
Requirement |
Points |
|
Charts
|
10 |
|
Custom Animation |
10 |
|
Sound |
10 |
|
Notes Page |
10 |
|
Grammar and Spelling Correct |
10 |
|
Clear basis for decisions is expressed |
10 |
|
Graphics from company web page or other graphics which complement/support company |
10 |
|
Background or Design |
10 |
|
Automatic transitions- Each slide should only be 5-10 seconds |
10 |
|
Element |
Description |
Points |
|
Professional |
Tri-fold No typos At least 1 company pictures |
25 |
|
Clear representation of investment benefits |
Attention to audience Evidence is presented |
25 |