ABSTRACT:
Wyandotte County Lake is an artificially constructed lake adjacent to the Missouri River in northwestern Wyandotte County/Kansas City, Kansas. The lake is fed by several streams and water runoff, and is drained at a single point into a channel that leads to the Missouri River. Landsat TM images of NE Kansas/NW Missouri were processed and analyzed using the IDRISI software package (www.clarklabs.org). The study area is small (less than 3kmx3km) and therefore only a small portion of the Landsat image was necessary and desirable. The Landsat data in BSQ format was transferred to the workstation, and an Idrisi compatible ".doc" file was created for each band using the information in the header file.
The relatively small window of the first band containing the lake was saved, and the cropped image used as a reference to crop the remaining bands in the image. Haze correction must be taken into account, but minimum and maximum values are not specified in the header file for the Landsat data. Therefore, a HISTOGRAM function must be performed on each band, and from that information, reasonable data minimum and maximum values may be determined, and haze correction performed using those results. The documentation files may be modified in conjunction with the SCALAR operation during the haze correction to compensate for skewed values and anomalous data points.
To determine the surface area of a body of water, the 4/3 band ratio is most useful. The haze corrected, cropped bands are processed as a 4 div 3 ratio and displayed. The RECLASS operator is used to reclassify the various data values to specific values based upon cutoff values. The GROUP operator, specifying diagonal links, is then used if necessary to group together contiguous values indicating continuous features. Finally, we RECLASS or ASSIGN specific values using the sampled values from the various groups in question, and perform the AREA function to return the lake/water system surface area in square kilometers.
The data on lake surface area from 1987, 1988, 1989, and
1991 is determined, and compared to several values for historical area
rainfall (prior month, prior 3 months, prior 6 months) to determine if
there is a correlation between these rainfall periods and the lake system
surface area. The change in lake surface area is graphed over time, and
a general statement of the dependence of lake surface area on rainfall
is made.
DATA
Information on historical precipitation amounts was found
at the National Oceanic and Atmospheric Administration's website, www.ncdc.noaa.gov.
The following information was found on the rainfall amounts in Northeast
Kansas, region 3 (see Chart 1 and Figure 1).
| Year | Precipitation, 1 month | Precipitation, 3 months | Precipitation, 6 months |
| 1987 | 3.19 | 14.05 | 22.06 |
| 1988 | 2.40 | 7.79 | 11.41 |
| 1989 | 2.98 | 9.7 | 13.01 |
| 1991 | 1.45 | 9.3 | 16.17 |
Table 1: Precipitation (in inches) recorded in NE Kansas, Section 3, from NOAA records.
Figure 1: Kansas, NOAA Sectionalization (www.ncdc.noaa.gov/onlineprod/drought/images/ks.gif)
Through image analysis using the Idrisi software and the
procedure outlined in the abstract, the following data for Wyandotte County
Lake surface area were generated:
|
|
|
|
|
|
|
|
|
|
|
|
|
|
|
|
Table 2: Calculated lake surface area |
Figure 2: Wyandotte County Lake surface area, calculated
using Landsat TM data and IDRISI software.
Figure 3, Precipitation in Northeast Kansas, 1987-1991.
Data from NOAA.
PROCESSED IMAGES
The raw data were processed as described in the abstract. The resultant image is boolean, and executing the AREA module from Idrisi finds the surface area of the features which have been selected through the reclassification.
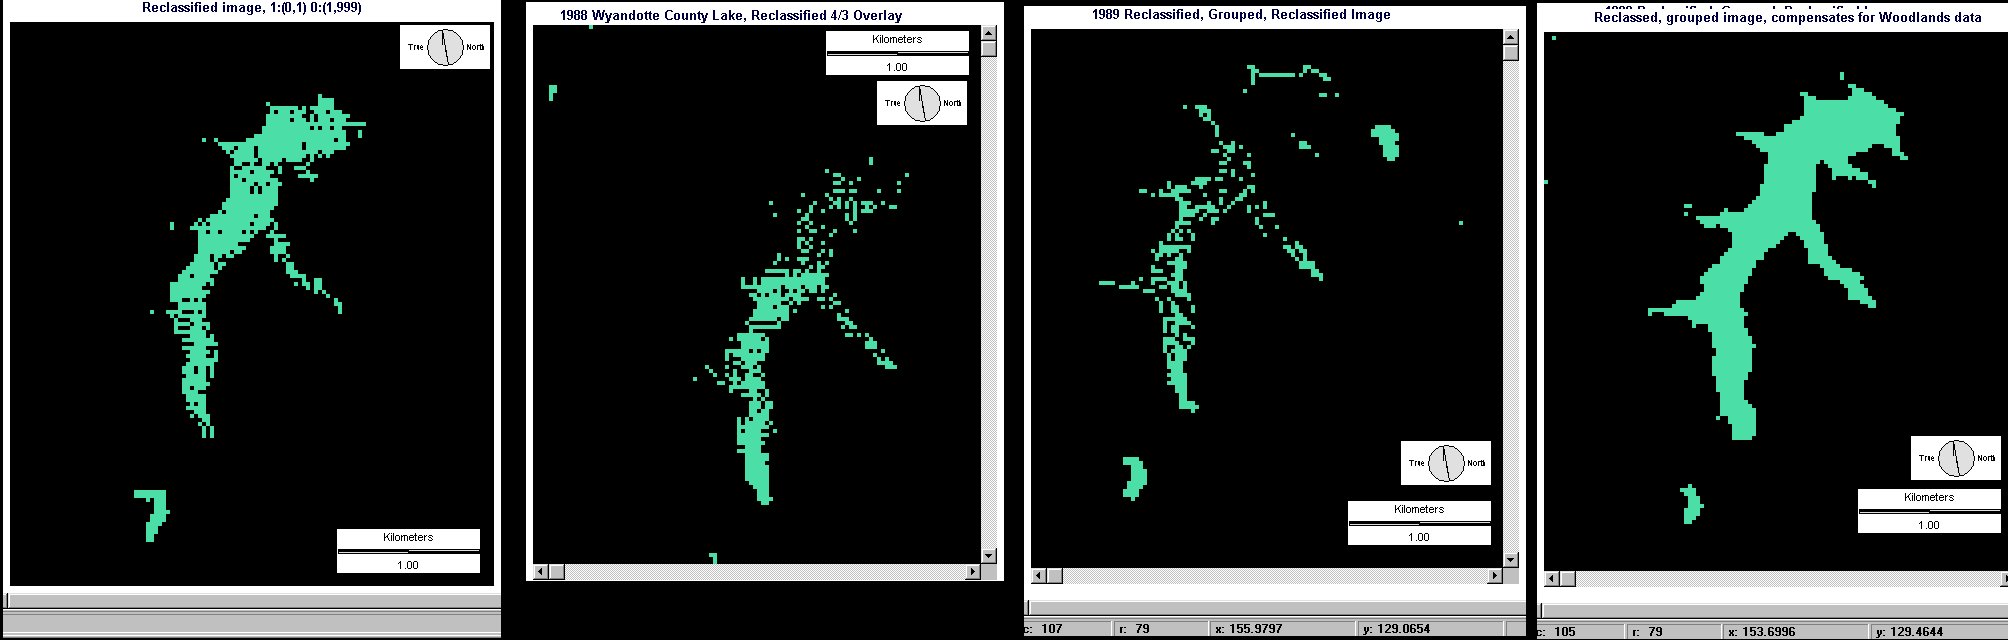
Figure 4: Boolean images of Wyandotte County Lake system,
from left: 1987, 1988, 1989, 1991.
In each case the same determinant factor was used to distinguish lake surface area from non-lake surface area. The consistent cutoff value for water vs. nonwater was a pixel value of 1.0 in the 4/3 band ratio.
A deviation from the standard system: In 1989, construction had begun on the Woodlands racetrack adjacent to the lake. During construction, the area was often flooded or extremely muddy, and therefore showed up in the 1989 image as a water feature. The parking lot of the structure again appeared as water (perhaps after rainshowers) in 1991. To compensate for this effect, the GROUP module was run under Idrisi to isolate continuous groups of data. The RECLASS operator was then used to select the lake area and deselect the construction/track area, thereby preventing the erroneous readings from affecting the outcome of the lake surface area determination.
The false color images in Figure 5 show the lake itself
in 1987 and 1991, and to the lower left of the lake, one can see the change
in land features (a human landuse change) that indicate the construction
of the gambling/racing complex. One can easily distinguish the oval of
the dog racing track.
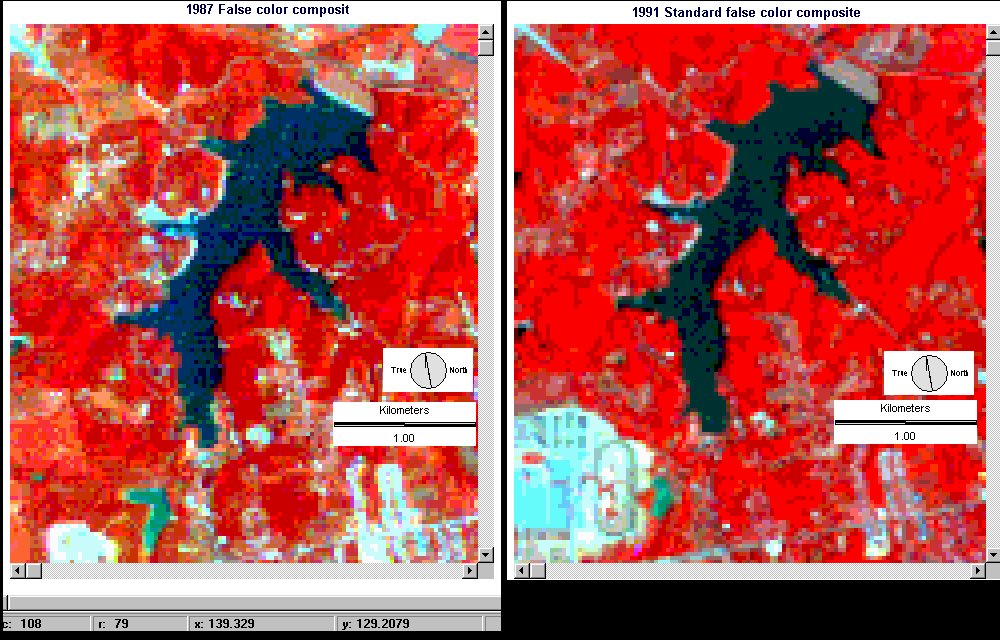
Figure 5: False color composite (Bands 1,2,4) for 1987
(left) and 1991 (right).
The previously mentioned Landsat TM 4/3 ratio image is
shown below, prior to the reclassification step used to clearly distinguish
between water and land.
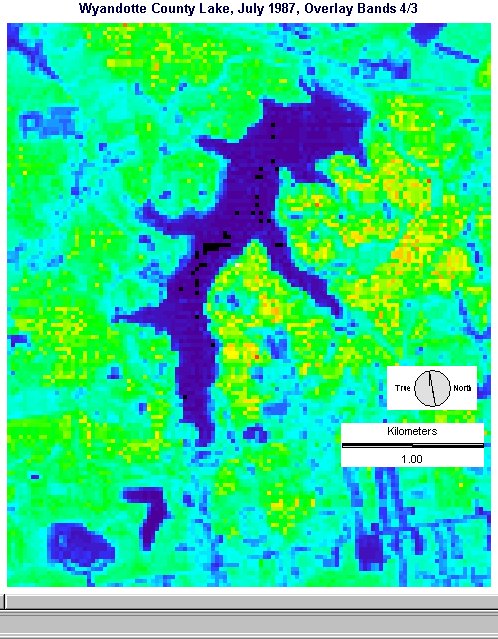
Figure 6: Landsat TM 4/3 Band ratio overlay
CONCLUSION
By comparing the precipitation charts with the lake area
charts, it is possible to see a correlation between precipitation and lake
area (and, consequently, water level). The drought is easily discernable
in the data, and is obvious in the boolean images iin Figure 4. Looking
at the precipitation graph, it is clear that the precipitation history
that spans a longer span, such as six months, prior to the data collection
is a better predictor of the lake level than that of a shorter time span,
such as is shown in the three or one month graph lines.
REFERENCES