
On this page you can find frequency spectrum images for most satellites that are received in Europe.
The images where obtained December 2007 using a Satlook Digital NIT connected to a 100cm dish mounted on a Motek SG-2100 rotor. The location of my site is north of Portugal, which means that the spectrum might look different in other geographic areas, due to the footprint of each satellite.
You can see a video of the spectrum here:
These images might be useful if you own a spectrum analyzer yourself and want to know, what each satellite looks like.
A spectrum analyzer is normally used to align satellite dishes. However, it is an excellent tool for feed hunting, as well, because you can actually see the transponders, even if you don't have access to a frequency list. It is also interesting to see that there are frequencies, which are clearly being used, but not to transmit analog or digital TV or radio transmissions. These frequencies are normally used for satellite internet services or other data services.
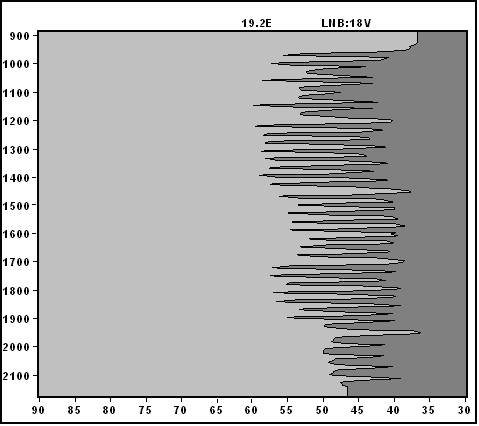
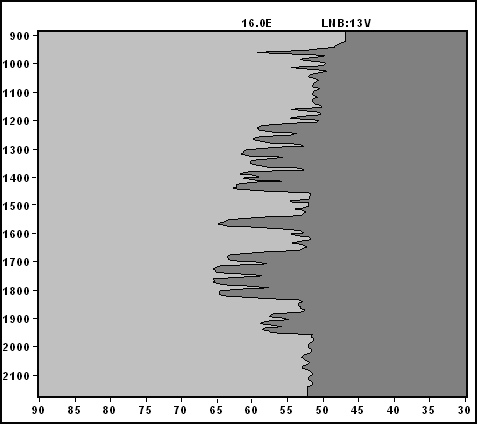
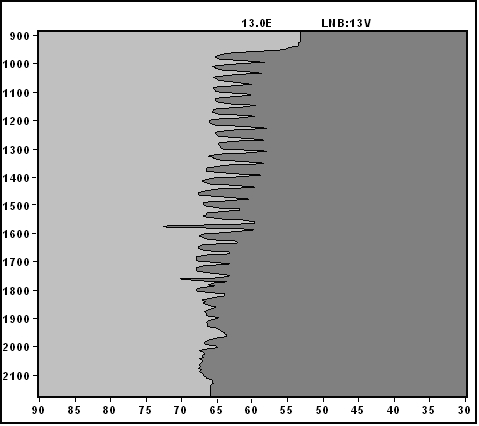
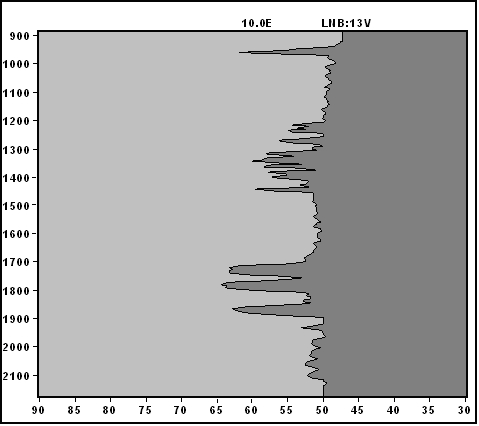
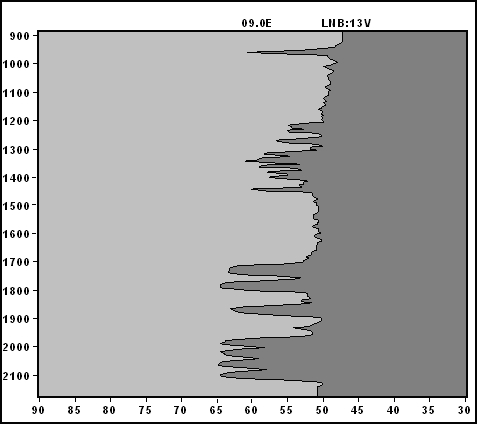
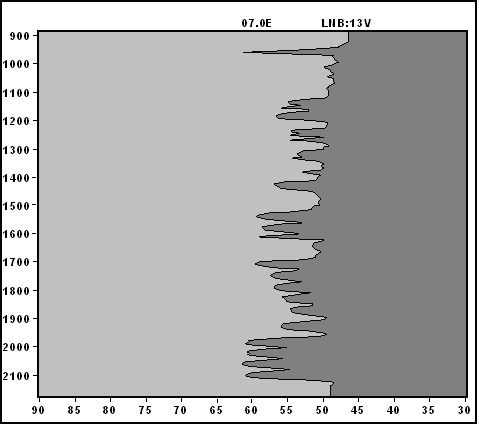
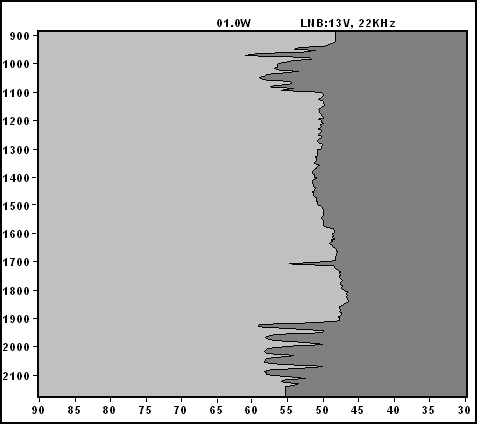
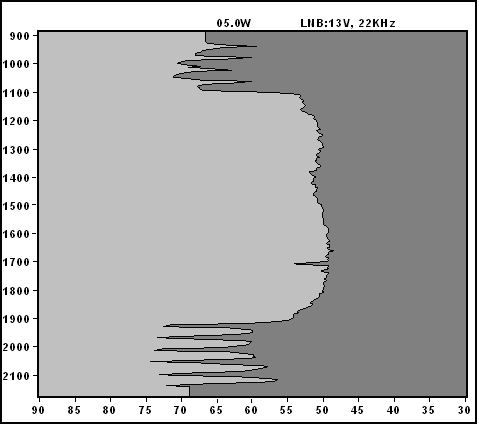
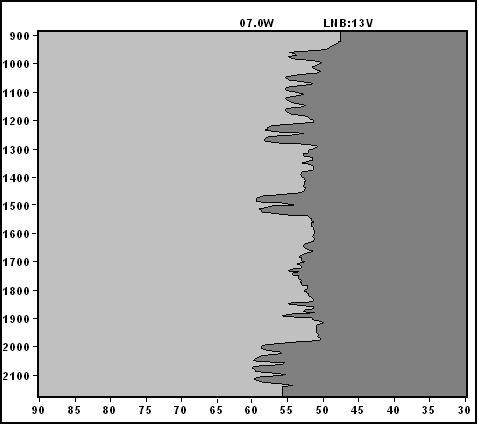
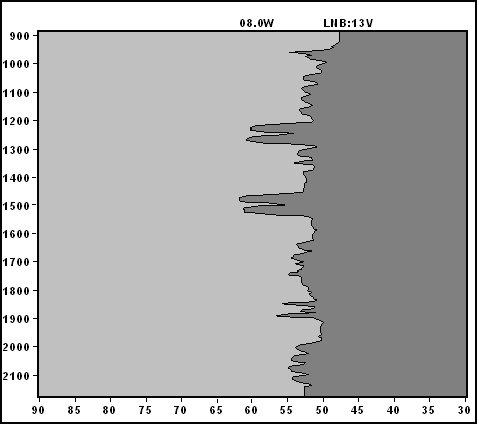
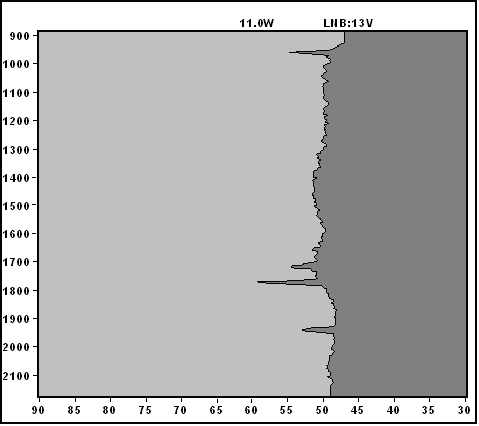
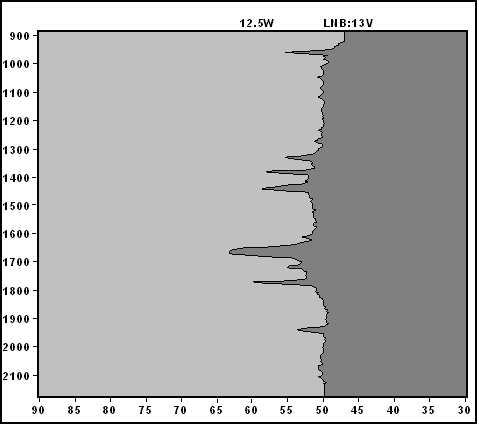
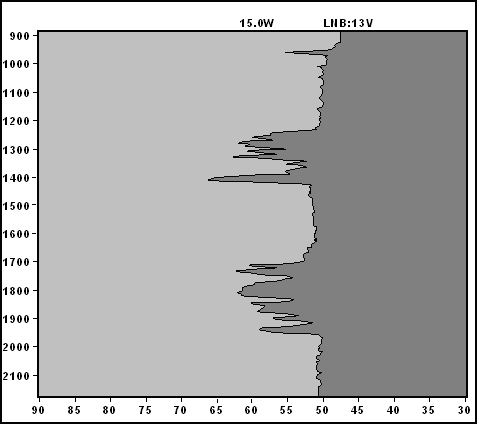
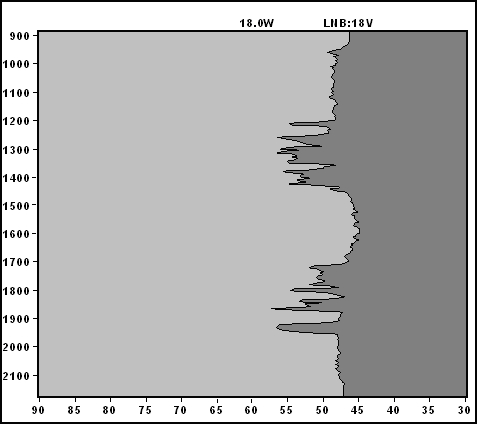
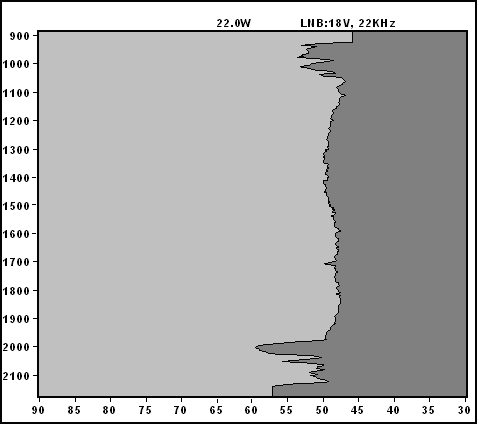
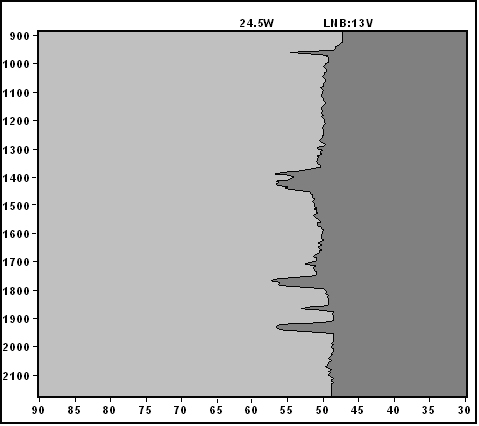
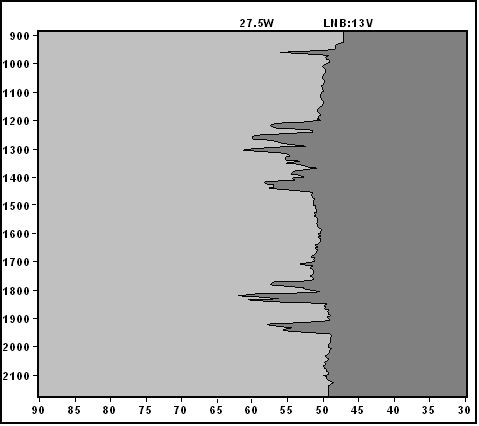
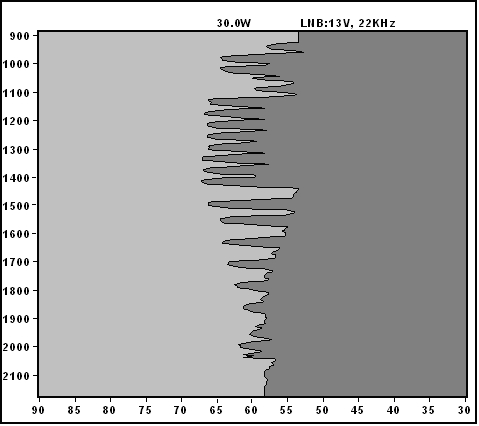
Each image has the satellite's position in the header, as well as information's about polarity and band: 0kHz (or no information) means Low Band (base frequency is 9.750 MHz) and 22kHz means High Band (base frequency is 10.600 MHz). 13V means Vertical Polarity and 18V means Horizontal Polarity.
If you want to know the frequency in a given picture, you need to make this addition:
0 kHz and i.e. 1200 MHz: 9.750 MHz +1.200 MHz = 10.950 MHz
22 kHz and i.e. 1200 MHz: 10.600 MHz + 1.200 MHz = 11.800 MHz
(C) 2007 by VMA