In a developing world, potable water is a limiting
factor for development. Providing drinking water to an increasing population
is more complex every year due to the reduction of quality and quantity
of surface or ground water or simple geological conditions (such as salt-water
intrusion of the water table or desert, dry surface conditions).
Many communities are reaching the limit of what their fresh water resources
have to offer. In the Arabian Gulf, water is more valuable than oil and
its control often leads to war. In states like Florida or California,
which both have experienced water shortages, water management is an essential
issue for growth management. Alternative sources are necessary to
meet the demand for potable water for the future generations.
Desalination techniques, such as membrane
technology, offer one solution to this difficult problem. By removing
contaminants such as salts, heavy metals, radionuclides and pathogens from
water of lesser quality, brackish or even saline water can be used to produce
potable water. For the past two decades, the use of a drinking water
production technology called reverse osmosis to provide potable water from
brackish and saline water sources has increased significantly.
1.1 What is Reverse Osmosis?
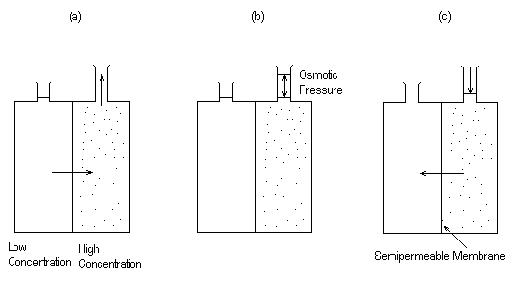
Osmosis is the diffusion flow between two solutions
(solvent plus dissolved species or solute) separated by a semi-permeable
membrane that only allows the solvent to pass through and acts as a barrier
for the solute. The solvent flows from the medium of lower concentration
toward the one of higher concentration (Raven and Johnson, 1991) (Figure
1.1 (a)). The pressure gradient between the two solutions is called
osmotic pressure difference and varies according the concentrations of
the solute and the type of solvent present in the two solutions (Figure
1.1 (b)). Reverse osmosis (RO) is effected when a pressure gradient
greater than the osmotic pressure difference is applied on the medium of
high concentration. In this case, the flow is reversed and the solvent
travels from high to low concentration areas and the separation of water
from solute becomes possible (Bhattacharyya and Williams, 1992) (Figure
1.1 (c)).
| Figure 1.1 Osmosis and Osmotic Pressure. (a) Solvent flows from the side of low concentration to the one of high concentration. (b) Before applying osmotic pressure, equilibrium is achieved. (c) The flow is reversed if a pressure greater than the osmotic pressure is applied on the medium of high concentration. (from Alsaygh, 1991) |
Applying pressure equal or greater than osmotic pressure to a saline solution will reverse the osmotic flow, and potable water will be produced on one side of the membrane while ions and dissolved gas will be concentrated on the other side. Seawater, brackish water or groundwater are treated through RO by using appropriate membranes and can be separated into potable water and concentrate.
1.2 Application of Membrane Technology in Drinking Water Treatment
Among all the desalination techniques, the
RO process allows the production of cleaner drinking water (Pontius, 1996).
Other desalination techniques include NanoFiltration or Membrane Softening
(NF or MS), MicroFiltration (MF) and UltraFiltration (UF) and Electrodialysis/Electrodialysis
Reversal (ED-EDR). However, RO remains the Best Available Technology
(BAT) according to USEPA (Pontius, 1996) to remove pathogens and most inorganic
and organic materials from water (Table 1-1) and is the only desalination
process with a filtration size smaller than 1 nm (Table 1-2).
| Table 1-1. Best available technology (BAT) to remove selected inorganic and radionuclides contaminants from water as well as the removal efficiency achieved for each of them. (Pontius, 1996) |
| Contaminant | BAT | Removal Efficiency
(percent) |
| (inorganics) | ||
| Antimony | RO | 69-77 |
| Barium | RO
EDR |
92-98
58-94 |
| Beryllium | RO | 96-99 |
| Cadmium | RO | 96-98 |
| Chromium | RO | 82-97 |
| Cyanide | RO | 85-99 |
| Fluoride | RO | 90-95 |
| Mercury | RO | >80 |
| Nickel | RO | >90 |
| Nitrate | RO
EDR |
67-95
51-92 |
| Nitrite | RO | 67-95 |
| Selenium | RO
EDR |
75-99
>71 |
| Sulfate | RO | 86-97 |
| (radionuclides) | ||
| Alpha Emitters (proposed) | RO | 98-99 |
| Beta particles and photon emitters (proposed) | RO | 90-99 |
| Radium 226 (proposed) | RO | 87-98 |
| Radium 228 (proposed) | RO | 87-98 |
| Uranium (proposed) | RO | 98-99.4 |
1.2.1 Descriptions of Desalination Processes (Pontius, 1996)Several desalination techniques can be used to produce fresh, potable water and include freezing techniques, distillation and membrane technology. The membrane desalination technologies not only remove the salt content from the salty and brackish water but also provide filtration which increases the quality of the water produced without including the energy costs involved in the thermal methods.
| Table 1-2. Operating conditions of the most common desalination processes: reverse osmosis (RO), nanofiltration or membrane softening (NF or MS) and electrodialysis/electrodialysis reversal (ED/EDR) (Mickley et al, 1993). |
| Techniques | Feedwater TDS (mg/l) | Operating Pressure
(psi) |
Recovery*
(%) |
Best for | Filtration Size
(nm) |
| RO | 10,000-45,000
3,500-10,000 500-3,500 |
high:800-1,200
medium: 600-800 low: 100-600 |
20-50
60-85 60-85 |
All
Type of Water |
<1 |
| NF or MS | 0.0-500 | 50-150 | 75-90 | Freshwater | 1-5 |
| ED-EDR | 500-7,500 | - | 70-95 | Brackish Water | - |
The basic principle is the same for all pressure driven membrane processes. When pressure greater than the osmotic pressure is applied to a saline solution, osmotic flow through a semi-permeable membrane is reversed and fresh water is produced. The major differences encountered lie in the types of membranes and the operating pressures used by the systems.1.2.1.1 Pressure Driven.
Saltwater Reverse Osmosis (SWRO) (high pressure RO) and
Brackish water Reverse Osmosis (BRO) (low and medium pressure RO):
Reverse Osmosis uses a very small pore size membrane and can operate
at different pressures according the salinity of the source water.
Brackish surface and groundwater sources are preferred to ocean water due
to higher costs for operation and maintenance of SWRO (energy costs for
high pressure pumps, maintenance of membranes and pumps degraded by scaling
and corrosion).
Membrane Softening (MS) (also known as NanoFiltration) (ultra-low
pressure):
Membrane softening operates at much lower pressure due to a membrane
more pressure sensitive than the one used in RO plants, and is very effective
with groundwater with low Total Dissolved Solids (TDS).
MicroFiltration (MF) and UltraFiltration (UF):
Micro and ultrafiltration use membranes with pore sizes larger than
the membranes used by RO and MS. Consequently, they are not efficient
filters for most of the ionic compounds. Micro and ultrafiltration cannot
be considered as full desalination techniques, and are only used to clarify
the source water. The water produced by those methods can not be
considered potable unless additional post-treatment is applied. MS and
UF are not used in the US but represent an interesting research subject.
Most MS and UF plants are found in Europe. The largest plant is located
near Paris, France and has a capacity of 15MGD [57,000 m3/d] (Adham et
al, 1996).
Electrodialysis/Electrodialysis Reversal (ED-EDR):1.2.1.2 Non-Pressure Driven:
1.2.2 Pre- and Post-Treatment to the Desalination ProcessesThe following treatments are part of the process of producing potable water using membrane technology. Pre-treatment of the feedwater or source water is necessary to remove chemicals such as carbonate or chlorine but also microorganisms, which may cause harm to the system or the membrane itself. Post-treatments such as chlorination prepare the water for distribution and consumption. Aeration and degasification are also applied to the concentrate to prepare it for disposal. The composition of the concentrate will depend on the source water but also the treatment used during processing. Some of these treatments, their purpose, and their effect on product water and concentrate are shown in Table 1-3. Most of the chemicals added for pre-treatment will stay in the concentrate. This is the case for the sulfate from the sulfuric acid used for pH adjustment and from the sodium bisulfite used to decrease chlorine levels that can be harmful for the membrane. Similarly, the post-treatments affect the concentrate composition. The presence of chlorine in the concentrate comes from desinfection of the desalination by-product before discharge. The aeration used to remove dissolved gases from the concentrate will oxidize hydrogen sulfide and ammonia into sulfate and nitrate and increase dissolved oxygen concentration. Moreover, the sodium level of the concentrate may be raised by using sodium hydroxide for pH adjustment.
| Table 1-3. A summary of pre- (a) and post- (b) treatment processes employed during potable water production by desalination (Mickley et al, 1993). |
| (a) Pre-treatment step | Purpose | Chemicals Added | Fate of Chemicals |
| pH Adjustment to 7 | Decrease Carbonate Concentration (and Carbonate Precipitation), Protect Membrane from Hydrolysis | Acid (H2SO4) | Affect pH of both produced water and concentrate, sulfate stays in the concentrate |
| Antiscalants | Prevent Formation of Scalling on the Membranes | Sequestering Agent, dispersants | Complexes formed stay in concentrate |
| Coagulation-filtration | Prevent Fouling and Clogging of the Membranes | Coagulants-flocculants | Flocullants formed settle out and are removed by filtration |
| Desinfection | Prevent Biological Fouling and Remove Microorganisms that feed on Membranes Material | Chlorine (or Biocides, UV) | Chlorine distributed equally in permeate and concentrate |
| Dechlorination | Protect Chlorine-Sensitive Membranes | Sodium Bisulfite or Granular Activated Carbon (GAC) | Reacts with Chlorine to form sulfate and chloride that stay in concentrate |
| (b) Post-treatment step | Purpose | Chemicals Added or Method Used | Fate of Chemicals |
| Remove Dissolved Gases | Remove Objectionnable Gases, CO2, Radon and H2S | Aeration, Degasification | Oxydize H2S and NH4 in both produced water and concentrate |
| pH Adjustment to 7 | Prevent Corrosion in Distribution System, Protect Aquatic Life in case of Surface Discharge | NaOH, soda ash, lime | Increase sodium level in both produced water and concentrate |
| Desinfection | Prevent Bacterial Growth in Distribution System, Protect Aquatic Life if necessary | Chlorine (or Chloramination) | Chlorine stays in produced water and concentrate |
| Reduction of Chlorine Level | Eliminate Chlorine and other Oxidizers | Sodium Bisulfite or GAC | Increase sulfate and chloride levels in both produced water and concentrate if necessary |
| Oxygenation | Increase Dissolved Oxygen to Level Supporting Aquatic Life | Aeration | Increase DO in Concentrate |
| Remove Other Species | Decrease any Pollutants that may be present in Produced Water and Concentrate | Depends on Species |
1.3 Concentrate Disposal
Worldwide, desalination plants use RO more than any
other desalination process to treat seawater as well as brackish and fresh
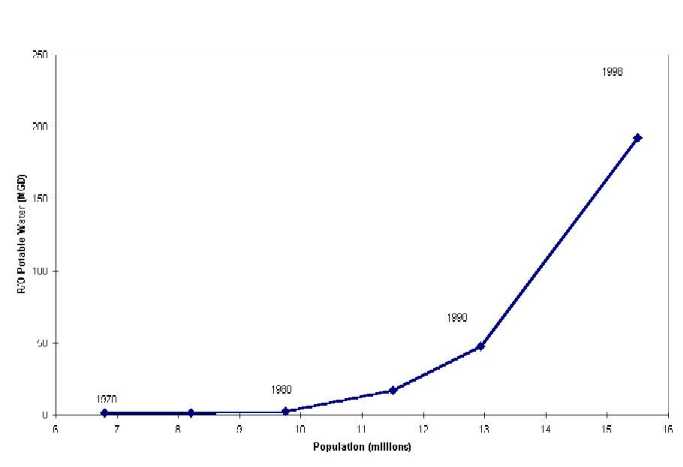
water (AWWA-MTRC, 1998). In Florida, the production of potable water
from brackish groundwater by RO has increased exponentially for the past
three decades (Figure 1.2). If the impacts on surface and groundwater supplies
due to the pumping of increased amounts of water to be treated can be minimized,
the major concern of the application of RO is for concentrate disposal.
| Figure 1.2 Production of potable water by desalination processes compared to Florida population growth (University of South Florida, 1998). |
1.3.1 What is the problem?Concentrate from potable water production by desalination is considered by the public to be a brine, a hypersaline solution several times more concentrated than seawater. Actually, desalination by-product is concentrated source water with a chemical composition similar to the source water (with the exception of a few chemicals added during post and pre-treatments of the desalination process) but with concentrations 2 to 5 times higher than the source water. The concentrations of chemical species of the groundwater and surface water used as feed water by membrane processes depend on a variety of different factors such as the geology of the terrain or the rainfall in the area and vary greatly from one place to an other. The concentrates obtained from those feed waters present great variations from one to another as can be seen in Table 1-4. For example, chloride can be found in desalination by-product in concentrations ranging from 100 mg/l to 30,000 mg/l according to the total dissolved solids (TDS) content of the feed water. Therefore, there are as many different concentrates as there are feed waters. However, the concentrate is classified as an industrial waste, which may be toxic to aquatic life (http://www.dep.state.fl.us/-ned/wfweb/pages/industri.htm).
Wastewater is classified by USEPA into five categories (40 CFR 35); each characterized by the absence or presence of coliform bacteria, or whether the waste stream results from agricultural activities, stormwater, thermal processes with temperature gradient, or industrial processes. Desalination concentrate was designated as industrial waste, a classification with more stringent regulations than domestic waste. These more stringent requirements have affected the use of reverse osmosis in the US.1.3.1.1 Why is concentrate classified as an industrial waste? Of what consequence is this classification for the disposal of concentrate?
| Table 1-4 Inventory and typical values of the chemical species found in desalination concentrate. |
| Major Ions and Constituents of Concentrate | Origin | Level in Concentrate (mg/l)* | USEPA Standards (mg/l) |
| Chloride | Source Water/Desinfection Process | 100-30,000 | <10% above the background value |
| Sodium | Source Water/pH adjustment | 50-20,000 | report** |
| Sulfate | Source Water/Dechlorination | 200-4,000 | 500 |
| Magnesium | Source Water | 30-2,000 | report** |
| Calcium | Source Water | 250-1,000 | report** |
| Bicarbonate | Source Water | - | |
| Potasium | Source Water | 10-500 | report** |
| Fluoride | Source Water | 0.5-10 | 5 |
| Iron | Source Water | - | report** |
| Ammonia | Source Water | - | |
| Hydrogen Sulfide*** | Source Water | 0.01-1 | 0.02 |
| Carbon Dioxide*** | Source Water | - | |
| Dissolved Oxygen | Added during Aeration of the concentrate before Discharge | 0.5-10 | > 5.0 |
| Radon | Source Water | 5-50 pCi/l | 20 pCi/l |
The production of concentrate does not include adding toxic chemicals, but only the removal of water from the source water. Often, the concentrations of materials found in the concentrate are below USEPA water quality standards. However, concentrates from several desalination plants have been found acutely and chronically toxic to aquatic life in a variety of bioassays performed by FDEP (http://www.dep.state.fl.us/labs/biol/BSSYmap.html). In addition, heavy metal contamination of sediments in the vicinity of concentrate discharge pipes from a Saudi Arabia SWRO water treatment plant has been documented in one non-peered reviewed publication (Sadiq, 1995). The increased concentration of fluoride, ammonium, heavy metals and/or radionuclides and dissolved gases such as H2S or CO2 can reach toxic levels, above USEPA maximum contamination levels (MCL), and cause mortality in organisms. The MCL is the minimum concentration that may be released in the environment before harmful effects occur. For example, the MCL for fluoride is 5mg/l according to USEPA, but fluoride has been found with concentration as high as 9.8 mg/l in the concentrate from the Jupiter RO plant in October 1994 (http://www.dep.state.fl.us/labs/biol/Report_Smmrys/-BSSY_Smmrys/CEdist/) while the fluoride levels of the Melbourne RO plant never got over 2 mg/l in three years of operation (Appendix A: Melbourne ROWTP NPDES monitoring results). Moreover, an imbalance in the ratios of major ions when compared to seawater has been observed frequently in concentrate derived from groundwater sources.1.3.1.2 Ion imbalance and toxicity.
1.3.2 What to do with the concentrate?Several alternatives are available for the disposal of the desalination by-product. The concentrate can be discharged to an adjacent surface water body or to a municipal sewer system, injected into a deep well, reused for land application or converted to solid waste. Here is a description of each of those options.
Discharging the concentrate into surface water is the most common method of concentrate disposal in the world and is the least expensive alternative (Mickley 1993). In the US, the Clean Water Act (1977) (USC 33 s/s 121 et seq.) states that the disposal of any effluent in surface water requires a National Pollutant Discharge Elimination System (NPDES) permit (40 CFR 122) (http://www.epa.gov/epahome/laws.htm). Discharges are allowed if the contaminants in the effluent meet certain standards set by USEPA (40 CFR 122.41-45), state or local environmental protection agencies (40 CFR 123.25). NPDES permits require extensive monitoring to include background conditions, effluent quality, and effluent toxicity. Recent concerns about concentrate toxicity have made discharge to surface water unpopular with the public (Florida Today, April 14th 1999).1.3.2.1 Dilution in surface water.
The wastewater is injected into a deep well, typically four hundred meters below the aquifer or any underground source of water present at the location of the well. Injection wells are used to dispose of a variety of liquid wastes ranging from domestic wastewater to hazardous material. This technique has been found to be safe by USEPA provided the material stays in the injection zone and operators respect regulations (42 USC s/s 300h).1.3.2.2 Deep Well Injection (DWI)
| Table 1-5. Deep injection wells for waste disposal as classified by the Underground Injection Control program (40 CFR 144.6). |
| Class I | Domestic and Hazardous Waste
(municipal wells) |
| Class II | Waste from Oil Industries |
| Class III | Waste from Mining Industries |
| Class IV | Radioactive Materials |
| Class V | All the other wastes (Septic Waste, Stormwater, Brine and Concentrate) |
Concentrate is an industrial waste but has not been included in the list of hazardous waste that can be injected in Class I wells. Desalination by-product requires a Class V well for deep well disposal. The costs associated with upgrading a Class I municipal well to a Class V well may limit the use of DWI for disposal of concentrate. In addition, the environmental consequences of deep well injection are not completely understood and require further investigations.
Discharging the concentrate to a municipal sewer system has the potential to be a good solution. Costs may be lower than the other method of disposal because wastewater treatment plant already exists. When concentrate and domestic water are mixed, both are diluted. The fecal coliform count of the domestic wastewater is reduced with the addition pathogen-free concentrate and the salt content of the concentrate is reduced by the dilution of fresh domestic wastewater. In addition, the overall toxicity of the blend may also be reduced. On the other hand, the volume of the concentrate may be greater than the treatment capacity of the POTW and may require a development of the facility.1.3.2.3 Sewage treatment or Publicly Owned Treatment Work (POTW).
Evaporation ponds have been used to store the concentrate, reduce its water content and dispose of the sludge as a solid waste. The pond must be designed to be leakproof to prevent groundwater contamination and, of course, evaporation pond applications are only possible in locations where the evaporation rates (usually measured in gallons/day/acre) are sufficiently high to promote rapid evaporation. Finally, the costs for this method include land acquisition, dredging, and sludge disposal.1.3.2.4 Land application (Evaporation ponds and irrigation).
Some plant operators propose to transform the concentrate into solid waste by evaporating all of its water content through crystallization and heat transfer. The concentrate is compressed and boiled to lower its water content. The efficiency of such system is measured with its percent rejection. The percent rejection is the percentage of the final volume of brine compared to the initial volume of concentrate. This method requires high-energy cost to provide evaporation heat, a major capital investment and the availability of a landfill designed to hold the waste products.1.3.2.5 Water minimization
According to Mickley (1993), the solution to
concentrate disposal other than surface discharge that answers the best
any financial and environmental concerns lies in deep well injection (when
the hydrogeology allows it) for large capacity plants (>0.5MGD [>1,900
m3]) and in land application (spraying) for smaller units (Table 1-6).
| Table 1-6 Comparative costs for non-surface discharge concentrate disposal options as a function of flow rate in thousands of dollars (1992) (Mickley et al., 1993) |
| Flow rate | Evaporation Ponds | Deep Well | Spray Irrigation | Brine Concentrator | ||||
| (MGD) | 750 GD/acre | 3,000 GD/acre | 2,500 ft | 10,000 ft | 2 ft/yr | 20 ft/yr | 2% rejection | 10% rejection |
| 0.01 | 806 | 276 | 663 | 1,705 | 154 | 41 | 1,812 | 2,078 |
| 0.1 | 6,672 | 1,794 | 663 | 1,705 | 984 | 204 | 3,086 | 3,730 |
| 1 | 66,720 | 17,940 | 927 | 2,300 | 8,286 | 1,272 | 15,740 | 19,230 |
Recently, the city of Melbourne has reviewed the
costs associated with three different alternatives for disposal of concentrate
from their RO facility which presently discharges to the Eau Gallie
River. The cost of a deep well injection solution were ranging from
3.5 to 10 millions dollars while displacing the point of discharge from
the creek to the Indian River Lagoon was estimated to cost $1 million (A
final alternative considered by the city involved an ocean outfall with
an estimated cost of $4 millions).
Membrane technology is a relatively new technology
developed industrially for only two decades. Much information about
the possible toxicity remains to be thoroughly investigated. As an
example, seawater ion imbalance as a cause of toxicity for aquatic organisms
has only recently been discovered. Similarly, little is known about
the effects of disposal methods.
![]() about
the author
about
the author
take a look at my resume.
![]() drop
me a lign or two with
drop
me a lign or two with
your comments and advices.
[email protected]