Florida is the largest user of brackish water
reverse osmosis (BRO) for groundwater treatment in the world in both capacity
and number of plants (Mickley et al., 1993). The capacity of BRO
plants has increased exponentially along with the states increasing population
(Figure 1.2). Saltwater intrusion into the aquifer, degradation of
surface water quality, along with a rapidly growing population and a potable
water demand that should increase by 60% by the year 2020, mandate the
development of alternative water resources for the coming decades (Vergara,
1998).
| Table 3-1 Importance of membrane plants in the production of potable water in Florida (http://www.dep.states.fl.us) |
| All plants | Membrane plants only | %Membrane/Total Plants | |
| Population | approximatly 15.5 millions | 1.3 millions | 9% |
| Drinking water Treated | approximatly 6,000 MGD | almost 200 MGD | 3% |
| Plants | almost 7,000 | approximatly 120 | 2% |
| Gal./day/capita | approximatly 400 | approximatly145 | 40% |
Almost 200 MGD [760,000 m3/d] of potable water
is produced by 123 desalination plants to serve 1.3 millions people out
of the 15 millions of people living in Florida (Table 3-1). Among
those plants, only two use EDR (in Sarasota and in Venice), and ten use
MS (in Lee, Broward and Palm Beach Counties); all of them have treatment
capacities greater than 0.5 MGD [20,000 m3/d]. Thirty-one of these plants
have a treatment capacity greater than 1 MGD [3,900 m3/d] and produce 171.4
MGD [670,000 m3/d] which represents around 90% of all the Membrane production
in Florida (FDEP, 1998). If 80% of the freshwater is recovered from
the source water, concentrate production is estimated to be 40 to 60 MGD
[156,000 to 234,000 m3/d].
Florida is the largest producer of membrane
water from groundwater in the world (Mickley et al., 1993). Therefore,
the sunshine state can be considered a pilot state for concentrate disposal
investigation by industry, and legislative and regulatory agencies.
NPDES and UIC permits require monthly monitoring of concentrate quality.
The number of plants in Florida along with the years of monitoring have
resulted in the largest database on the nature of concentrate discharges
and their disposal in the country. Most articles published in the
literature on brackish desalination focus on Florida plants or projects
whether they deal with cost considerations, plant operations, membrane
upgrades or by-product disposal.
Regardless of the difficulty in obtaining
permits, FDEP favors RO and Membrane Technology for drinking water production
in areas where adequate supplies of potentially potable water are not available.
In 1997, FDEP proposed changing the classification of membrane concentrate,
removing the industrial waste designation. The FDEP also proposed
establishing a new classification for a blend of concentrate and domestic
wastewater. Changing this classification would also simplify the
permitting process for smaller facilities (treatment capacity less than
1MGD [3,800 m3/d]). This proposal also favors the establishment of
mixing zones for RO discharges. In addition, Class I municipal wells
could be used for disposal of concentrate, avoiding the costs of upgrading
to a Class V well. The USEPA is presently considering this classification
system. In addition, legislation is pending in Congress which would
implement this classification system (Bill HR 1106, 1999).
3.1 Monitoring
3.1.1 Water Quality.Several ions are already the target of FDEP concerns. Among these, fluoride represents a major interest. The fluoride concentrations are sometimes high in groundwater and the FDEP maximum level (5 mg/l) is often reached in concentrate. However, the mechanism of fluoride toxicity is still unclear and will require more investigations to be completely understood (AWWA-MTRC, 1998).
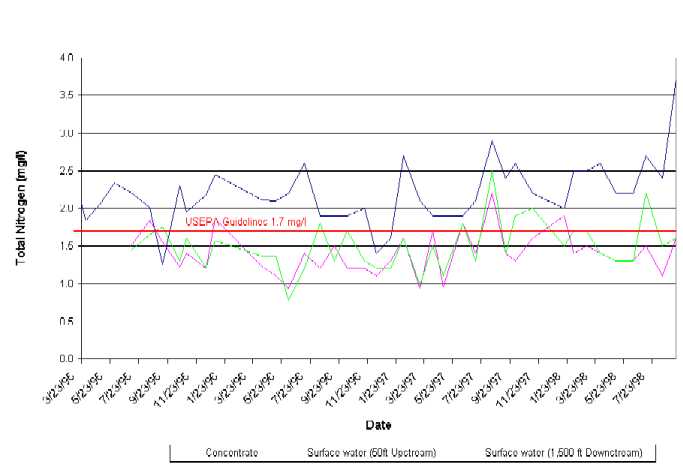
| Figure 3.1 Total nitrogen concentration in the concentrate from the Melbourne RO plant and in the Eau Gallie river, upstream (50 feet above the point of discharge) and downstream (1,500 feet below the point of discharge) from the point of discharge of the concentrate (City of Melbourne, 1998). |
Similar concerns are also true about gross alpha
radiation and some heavy metals, which have been reported in concentrations
higher that the surface water quality standard listed in the rule 62-302.400
FAC. For example, in 1993, mercury concentrations of the concentrate
from the Indian River County North Beach Reverse Osmosis Plant of Wabasso
have been found around 0.34 µg/L, which exceed the 0.025 µg-Hg/L
allowed in Class II waters (http://www.dep.state.fl.us/-labs/biol/Report_Smmrys/BSSY_Smmrys/-CEdist/9303_03CE.html).
The toxicity of a concentrate is usually blamed
on a specific toxic compound if it is detected in concentration violating
water quality standards. However, it is sometimes difficult to determine
the cause of effluent toxicity if none of the common toxic species is found
at suspect levels. Thousands of different toxicants from heavy metals
to pesticides are a potential menace for aquatic life. Each of them
can be detected with a specific method and is harmful at a specific level,
and it is virtually impossible to check for all of them in a given concentrate.
3.1.2 Toxicity.
| Table 3-2 Comparison of source waters and concentrates at four Florida desalination plants (FDEP, 1993). The concentration factor (CF) is the ratio of the concentration of the source water over the value for the concentrate. The relative standard deviation (RSD) of the CF is given to provide an order of idea of the variation The calculated values are the theoretical values obtained from the chloride concentration of the concentrate using the standard seawater ions ratio (Berner and Berner, 1996). |
|
|
|
(mg/l) |
|
(mg/l) |
|
|
(mg/l) |
(mg/l) |
|
(ppt) |
C
Mean |
F
RSD* (ppt)
|
| Anclote River
SWRO |
Concentrate |
538 |
1670 |
482 |
14233 |
214 |
23667 |
1 |
3600 |
42.76 |
|
|
|
|
CF |
1.65 |
1.62 |
1.66 |
1.59 |
1.57 |
1.51 |
1.62 |
1.69 |
1.51 |
|
|
| Ft. Myers Memb. Softening NF |
Concentrate |
309 |
43 |
12 |
91 |
532 |
170 |
1 |
277 |
0.31 |
|
|
|
|
CF |
4.10 |
4.51 |
2.89 |
2.55 |
2.85 |
2.97 |
1.59 |
16.94 |
2.97 |
|
|
| Jupiter RO
BRO |
Concentrate |
479 |
719 |
205 |
5763 |
550 |
9667 |
5 |
1900 |
17.82 |
|
|
|
|
CF |
3.76 |
3.83 |
3.52 |
3.58 |
3.64 |
3.40 |
3.59 |
3.61 |
3.40 |
|
|
| Venice RO
BRO |
Concentrate |
879 |
337 |
337 |
14 |
380 |
230 |
810 |
4 |
2800 |
1.46 |
|
|
|
CF |
1.95 |
1.95 |
1.82 |
1.76 |
1.82 |
1.80 |
2.42 |
2.00 |
1.80 |
|
|
A comparison between concentrate and source
water at four Florida membrane plants is shown in Table 3-2. These
plants have been chosen as case studies, because they represent several
treatment processes: one SWRO (Anclote River Pilot Plant), one low pressure
BRO (Venice RO Plant), one medium pressure BRO (Jupiter RO Plant) and finally
one NF (Ft Myers MS).
The Concentration Factor (CF) is the ratio
between the concentration of the concentrate over the source water concentration
for a given ion. It is dependent on the recovery rate of the plant.
The CF values for the four plants vary from 1.6 for the SWRO plant (50%
recovery) to 4.6 for the NF plant (90% recovery). The CFs of the
different chemical species for the three RO plants seem to be consistent
for each individual plant with relative standard deviations (RSD) between
40 and 110 ppt. This means that the ions present in the source water
are concentrated in the desalination by-product by the same amount.
On the other hand, the RSD of the NF plant of 1000 ppt is due to an impressive
sulfate enrichment (CF=17) and a selective behavior of the NF membrane
to double charged ions. The sulfate probably comes from pre- (sulfuric
acid for pH control) or post-treatments (high level of hydrogen sulfide
transformed into sulfate by aeration).
The calculated values are the theoretical
values obtained from the concentrates chloride concentration using the
standard seawater ions ratio (Berner and Berner, 1996). Chloride
has been chosen as it is the most abundant ions in seawater. A deviation
between the concentrate values and the calculated concentrations shows
an ion imbalance. It seems that such an imbalance may lead marine
and estuarine aquatic life to be exposed to concentrate toxicity.
This toxicity may also prevent plants from discharging the concentrate
to surface brackish water.
In the case of the toxicity testing results
from the Melbourne ROWTP presented in Appendix A, it seems that the undiluted
concentrate from the facility was chronically toxic for both the island
silverside fish (Menidia beryllina) and the mysid shrimp (Mysidopsis
bahia) but only acutely toxic to the mysid shrimp. However, a
fourfold diluted effluent passes the toxicity screen in each cases.
A fourfold dilution can be obtained with an appropriate mixing zone.
In the case of the Melbourne plant, the mixing zone extends 1,500 feet
after the point of discharge. If a mixing zone is allowed, the water
tested for toxicity should be collected at the end of the mixing zone and
not at the point of discharge.
In 1993, FDEP tried to develop a testing protocol
that would indicate whether the concentrate represents toxicity to the
receiving water aquatic life and whether this toxicity results from the
presence of specific toxicants or from an imbalance in the major sea water
ions ratio. Indeed, several concentrates from plants using fresh and brackish
water as source water were tested during the elaboration of the protocol
and clearly presented a major sea ions imbalance and were found toxic (FDEP,
1993). However, the whole protocol relies on very accurate analytical
chemistry and toxicology. The concentrations of all the different
major ions present in the concentrate have to be known with extreme accuracy.
Each steps of the toxicology testing increases the difficulty of obtaining
reliable results. General consulting laboratories may not be able to perform
such intricate method which will probably be reserved for exceptional situations..
The whole protocol still needs further examination and would benefits from
peer review.
3.2 Proposed Options for Concentrate Disposal
3.2.1 Surface Discharge.Florida DEP has recently been delegated authorities to issue NPDES permits that were issued by USEPA Region IV prior to 1996. Rule 62-302 (formerly known as 17-302) of the Florida Administrative Code regulates water quality standards of Florida surface water and dictates NPDES permit requirements. Discharge to surface water is a common practice, often used by units of small and medium capacities (<1 MGD [3,800 m3/d]). This alternative for concentrate disposal does not rely on complex engineering and is relatively inexpensive, the major costs being pipe maintenance and monitoring. On the other hand, the impacts of the concentrate on the surface water aquatic life are still unclear and are poorly documented. For priority water bodies like the Indian River Lagoon, surface discharge does not appear to be acceptable by general public. As a result surface water discharge to dispose of concentrate may be a politically difficult alternative.
3.2.2 Blending with Domestic wastewater and POTW.Discharging the concentrate to a wastewater treatment plant addresses most of the problems linked with surface discharge. The toxicity of the concentrate to aquatic life and the specific ion imbalance issues are no longer of concern, the bacteria of the POTW are able to handle them. This appears to be a potential solution for small units (treatment capacity less than 1MGD [3,800 m3/d]). Larger plants will likely require upgrading the capability and capacity of the wastewater treatment plant in order to treat increased volume of wastewater and may require a major financial investment.
3.2.3 Deep Well Injection.The use of deep well injection also reduces the concerns about the toxicity of the concentrate. While DWI is the primary means of concentrate disposal chosen by many larger capacity plants (>1MGD [3,800 m3/d]), deep well may not be the best alternative in many areas where the geology may not have an appropriate injection zone or confining layers (e.g. Flager County where the layers under the aquifer are too permeable). A UIC permit is required as well as upgrading the Class I municipal well to Class V. The upgrade and maintenance of Class V wells are very costly compared to surface discharge.
3.2.4 Land Application and Evaporation Pond.Evaporation ponds are not practical in a state with an average relative humidity of 80% through most of the year (Mickley et al, 1993). This alternative may be appropriate for very small capacity plants (<0.3 MGD [1,140 m3/d]). On the other hand, using concentrate for spray irrigation seems to offer more potential, especially in a state with so many golf courses. However, the salt tolerance of vegetation to be irrigated and the potential impacts of the desalination by-product to groundwater quality must be reviewed when considering this option.
A combination of methods of disposal is most
likely to offer the best answer to the question of concentrate disposal.
Surface discharge can be coupled with deep well injection or a sewer system;
deep well injection may be associated with blending of wastewater (which
is not considered Industrial Waste allowing the use of Class I Wells) where
possible. Domestic wastewater treatment plants receiving concentrate
will probably need to increase their capacity to accommodate this increased
flow.
| Table 3-3 Method of concentrate disposal in Florida in 1993 by the number of plants and by the volume of concentrate disposed (Mickley et al, 1993) |
| By plant number | Number of plants | By volume | Volume of concentrate (MGD) | |
| Surface Discharge | 47% | 58 | 44.5% | 22.25 |
| Land Application | 20% | 25 | 7.5% | 3.75 |
| POTW | 15% | 18 | 10.5% | 5.25 |
| Deep Well Injection | 16% | 20 | 37% | 18.5 |
| Evaporation Ponds | 2% | 2 | 0.5% | 0.25 |
![]() about
the author
about
the author
take a look at my resume.
![]() drop
me a lign or two with
drop
me a lign or two with
your comments and advices.
[email protected]