You
should aim for minimum happiness in every city first. Sometimes you can
leave a city at 72 happiness, but there is a 10% chance of a riot for
every happiness point below 73, so you should always aim for 73.
When your lowest city happiness is above 73 you should start to maximise your sliders. If you already have your sliders maximised you can still keep increasing happiness, as higher happiness will reduce crime, and you will need more happiness buildings in later governments that have higher expectations.
======
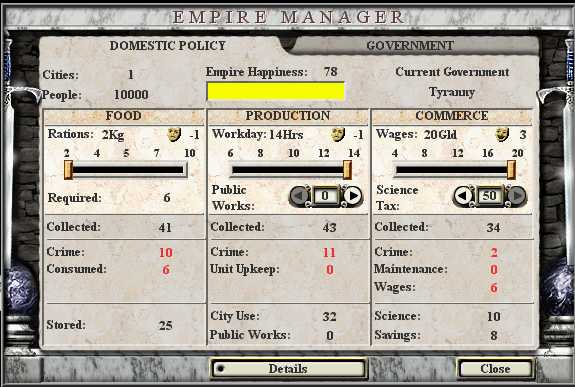
Rations: First of all the numbers above the slider: 2, 4, 5, 7, and 10 "Kg" mean NOTHING. They are there just for show, nothing more. The REAL internal numbers are as follows: 6, 9, 12, 15, 18. That is, each population point (not the "people" figure, that is another useless piece of information, just pop points * 10000) CONSUMES 6-18 food a turn. You can see in the picture above, it shows the empire manager for a single size 1 city, it's on the lowest rations setting and it says "Consumed: 6", not 2 as the slider says.
Note: the only time the consumed figure will be different is when a city has slaves. Slaves eat half rations, but they are not included at all in the "Consumed" figure.
Then the government modifier is added. In the case of Tyranny it's 0.85 for example. In the picture above, the real food collected is probably around 49, so 0.85 of that is 41 (rounded down) collected.
At this point (before crime) modifiers to food are added like the Granary, Food Silo etc.
The "Crime" figure should be obvious, but in this case crime is around 25% in the single city, "stealing" 10 from the 41 food collected.
And as you can see the remaining food goes to be "Stored", where it increases your cities growth. So obviously less rations (or food "consumed") and less crime, equals more food going to be "Stored". "Required" is the same as consumed.
======
Workday: Again ignore the "Hrs" numbers (6, 8, 10, 12, and 14) above the slider completely, they have no effect. What is important to know here is what does each slider position mean?
First of all, unlike the rations slider which modifies what each population consumes, the production slider modifies how much production is collected.
What does each position mean? When the slider is in the centre (that is "10hr" workday) production collected will have no modifier. For each movement it will have an effect of -0.15 production left and +0.15 production right. So workday maximised will give +0.3 of normal production, minimised workday -0.3 of normal production.
For example if a city is collecting 50 production at a 10hr workday (no modifier), it will collect 57.5 (or 57 as it rounds down) production at a 12hr workday, and 65 at 14hr workday. And 42.5 (42) at 8hr workday, and 35 at 6hr workday.
Then there is also a government modifier to production collected. For example in Tyranny production is 0.85 of "normal" production collected, "normal" being the production values you see on the terrain. So a city surrounded by 50 production on the terrain, in Tyranny, and with a workday of "12hrs", will collect production at 100%, or all 50. 0.85 (Tyranny) + 0.15 (12hr Workday) = 1 or 100% terrain production collected.
Same as food, building production modifiers like the Mill and Factory are added, then crime is deducted from each city...
Again in the picture above 25% crime in the one city deducts 11 production, which leaves 32 for "City Use". In the picture above there are no units, but "Unit Upkeep" is also deducted (as a percentage, seen in Unit Manager F8) from each city before "city use".
"City Use" is what you have left over to build things, generate public works etc. Remember what you see in the City Manager (F3) is NOT "City Use", it is before crime and unit upkeep have been deducted. This is not very useful for seeing the final figures, but can still be used to see if a building would be worth building there.
======
Wages: Again the figures above the slider (4, 8, 12, 16, 20) mean nothing. The real wages are 2, 3, 4, 5, 6 gold per "person", or population.
...
When your lowest city happiness is above 73 you should start to maximise your sliders. If you already have your sliders maximised you can still keep increasing happiness, as higher happiness will reduce crime, and you will need more happiness buildings in later governments that have higher expectations.
======
Rations: First of all the numbers above the slider: 2, 4, 5, 7, and 10 "Kg" mean NOTHING. They are there just for show, nothing more. The REAL internal numbers are as follows: 6, 9, 12, 15, 18. That is, each population point (not the "people" figure, that is another useless piece of information, just pop points * 10000) CONSUMES 6-18 food a turn. You can see in the picture above, it shows the empire manager for a single size 1 city, it's on the lowest rations setting and it says "Consumed: 6", not 2 as the slider says.
Note: the only time the consumed figure will be different is when a city has slaves. Slaves eat half rations, but they are not included at all in the "Consumed" figure.
Then the government modifier is added. In the case of Tyranny it's 0.85 for example. In the picture above, the real food collected is probably around 49, so 0.85 of that is 41 (rounded down) collected.
At this point (before crime) modifiers to food are added like the Granary, Food Silo etc.
The "Crime" figure should be obvious, but in this case crime is around 25% in the single city, "stealing" 10 from the 41 food collected.
And as you can see the remaining food goes to be "Stored", where it increases your cities growth. So obviously less rations (or food "consumed") and less crime, equals more food going to be "Stored". "Required" is the same as consumed.
======
Workday: Again ignore the "Hrs" numbers (6, 8, 10, 12, and 14) above the slider completely, they have no effect. What is important to know here is what does each slider position mean?
First of all, unlike the rations slider which modifies what each population consumes, the production slider modifies how much production is collected.
What does each position mean? When the slider is in the centre (that is "10hr" workday) production collected will have no modifier. For each movement it will have an effect of -0.15 production left and +0.15 production right. So workday maximised will give +0.3 of normal production, minimised workday -0.3 of normal production.
For example if a city is collecting 50 production at a 10hr workday (no modifier), it will collect 57.5 (or 57 as it rounds down) production at a 12hr workday, and 65 at 14hr workday. And 42.5 (42) at 8hr workday, and 35 at 6hr workday.
Then there is also a government modifier to production collected. For example in Tyranny production is 0.85 of "normal" production collected, "normal" being the production values you see on the terrain. So a city surrounded by 50 production on the terrain, in Tyranny, and with a workday of "12hrs", will collect production at 100%, or all 50. 0.85 (Tyranny) + 0.15 (12hr Workday) = 1 or 100% terrain production collected.
Same as food, building production modifiers like the Mill and Factory are added, then crime is deducted from each city...
Again in the picture above 25% crime in the one city deducts 11 production, which leaves 32 for "City Use". In the picture above there are no units, but "Unit Upkeep" is also deducted (as a percentage, seen in Unit Manager F8) from each city before "city use".
"City Use" is what you have left over to build things, generate public works etc. Remember what you see in the City Manager (F3) is NOT "City Use", it is before crime and unit upkeep have been deducted. This is not very useful for seeing the final figures, but can still be used to see if a building would be worth building there.
======
Wages: Again the figures above the slider (4, 8, 12, 16, 20) mean nothing. The real wages are 2, 3, 4, 5, 6 gold per "person", or population.
...