*****
Maharashtra Profile on Crime Against Women: DOWRY
---- Leena
Mehendale, IAS
Dowry is undoubtedly a stigma on the Indian society. A girl leaves her parental house around the age of 20 years and accepts the matrimonial house as her home where she would spend the rest of life. Her well-being, sense of security, confidence and empowerment, everything depends on the treatment that she gets during the initial period immediately after the marriage. The menace of dowry torture increased so much during the last twenty years that now it has become a threat to the sense of well-being of the newly married girl. After a large number of cases of dowry torture and dowry deaths came to be reported, the Dowry Prohibition Act which was passed by the government of India in 1961 was twice modified and made further stringent in 1984 and 1986. Now there is a provision that if any girl dies within the first seven years of marriage, then it shall be presumed that there was an element of dowry harassment and torture. The punishment for demanding dowry has been increased to 5 years of imprisonment, dowry harassment has been made a non- bailable offence, and demanding financial gratification even after marriage has been included in the definition of dowry demand.
Even then the crime of dowry has continued unabated. This has become another reason for parents to feel worried about the worth of a girl child. This in turn has led to many instances of female infanticide, female foeticide and now rejecting female foetus by a pre-sex-selection technology in which a huge bunch of male sperms are vigourously churned to separate sperms containing xx and xy chromosomes, and the female egg from the mother is selectively fertilized by the sperm containing xy chromosomes only and inserted in the mother’s womb, thus blanking out all possibilities of conceiving a girl child. All this has resulted in a heavy imbalance in the female male sex ratio which is a pre-cursor of a societal violence. The female –male sex ratio in the age group of 0-6, was only 927 by 2001 as seen in the latest census. Such social and demographic considerations have to be kept in mind while analysing the crime record of dowry deaths.
As a part of my study of crimes against women in Maharashtra, I analysed the five year data from 1995 to 1999 as available in these reports, and came up with some notable facts, which will provide the basis for making any policy recommendations.
Chart 1 shows a districtwise and revenue divisionwise details of dowry deaths registered by police between the period 1995 to 1999 alongwith the five-year average and the rate of dowry deaths per one crore of population. It is seen that every year around 400 dowry deaths have occurred in Maharashtra that comes to 45 dowry deaths per crore population.
Chart 1
|
< dist. |
popln96 (000) |
dowd95 |
dowd96 |
dowd97 |
dowd98 |
dowd99 |
5 yr tot |
ave |
rate |
|
|
|
|
|
|
|
|
|
|
|
|
mumbai+ |
15000 |
27 |
34 |
49 |
52 |
69 |
231 |
46 |
31 |
|
|
|
|
|
|
|
|
|
|
|
|
SINDHUDURG |
859 |
0 |
1 |
1 |
0 |
0 |
2 |
0 |
5 |
|
RATNAGIRI |
1633 |
0 |
1 |
0 |
0 |
2 |
3 |
1 |
4 |
|
RAIGAD |
2020 |
0 |
0 |
0 |
0 |
0 |
0 |
0 |
0 |
|
thane + |
6979 |
6 |
2 |
10 |
6 |
10 |
34 |
7 |
10 |
|
|
|
|
|
|
|
|
|
|
|
|
|
3295 |
37 |
34 |
27 |
31 |
53 |
182 |
36 |
110 |
|
SANGLI |
2422 |
14 |
16 |
11 |
11 |
4 |
56 |
11 |
46 |
|
solapur+ |
3595 |
31 |
17 |
16 |
13 |
3 |
80 |
16 |
45 |
|
SATARA |
2685 |
20 |
17 |
16 |
19 |
12 |
84 |
17 |
63 |
|
pune+ |
6389 |
38 |
20 |
18 |
15 |
3 |
94 |
19 |
29 |
|
|
|
|
|
|
|
|
|
|
|
|
nashik+ |
4384 |
10 |
6 |
10 |
7 |
15 |
48 |
10 |
22 |
|
dhule+ |
2818 |
46 |
54 |
55 |
60 |
48 |
263 |
53 |
187 |
|
JALGAON |
3515 |
2 |
0 |
1 |
1 |
1 |
5 |
1 |
3 |
|
AHMEDNAGAR |
3757 |
5 |
2 |
1 |
1 |
0 |
9 |
2 |
5 |
|
|
|
|
|
|
|
|
|
|
|
|
|
2161 |
66 |
50 |
17 |
19 |
13 |
165 |
33 |
153 |
|
JALNA |
1567 |
14 |
12 |
5 |
5 |
5 |
41 |
8 |
52 |
|
parbhani+ |
2400 |
21 |
27 |
22 |
27 |
9 |
106 |
21 |
88 |
|
NANDED |
2684 |
32 |
19 |
16 |
20 |
21 |
108 |
22 |
80 |
|
BEED |
2065 |
5 |
9 |
2 |
5 |
5 |
26 |
5 |
25 |
|
LATUR |
1907 |
40 |
56 |
45 |
45 |
60 |
246 |
49 |
258 |
|
OSMANABAD |
1419 |
6 |
14 |
6 |
12 |
5 |
43 |
9 |
61 |
|
|
|
|
|
|
|
|
|
|
|
|
BULDHANA |
2106 |
14 |
14 |
38 |
10 |
7 |
83 |
17 |
79 |
|
|
2435 |
1 |
2 |
3 |
4 |
4 |
14 |
3 |
11 |
|
|
2390 |
11 |
8 |
11 |
20 |
4 |
54 |
11 |
45 |
|
YAVATMAL |
2270 |
5 |
1 |
11 |
12 |
5 |
34 |
7 |
30 |
|
|
|
|
|
|
|
|
|
|
|
|
bhandara+ |
2256 |
6 |
7 |
5 |
6 |
7 |
31 |
6 |
27 |
|
|
3718 |
5 |
6 |
10 |
7 |
12 |
40 |
8 |
22 |
|
WARDHA |
1144 |
2 |
3 |
4 |
3 |
1 |
13 |
3 |
23 |
|
CHANDRAPUR |
1980 |
2 |
3 |
2 |
0 |
1 |
8 |
2 |
8 |
|
GADCHIROLI |
874 |
2 |
0 |
1 |
1 |
1 |
5 |
1 |
11 |
|
|
|
|
|
|
|
|
|
|
|
|
all maha |
92727 |
468 |
435 |
413 |
412 |
380 |
2108 |
422 |
45 |
• Fig 1 gives five line-graphs for the districts of all Maharashtra, Dhule, Latur, Mumbai, Kolhapur and Aurangabad over the period of five years.


Chart 2
|
< dist. |
popln96 |
dowd95 |
dowd96 |
dowd97 |
dowd98 |
dowd99 |
5 yr tot |
ave |
rate |
|
DHULE+ |
|
46 |
54 |
55 |
60 |
48 |
263 |
53 |
187 |
|
LATUR |
|
40 |
56 |
45 |
45 |
60 |
246 |
49 |
258 |
|
mumbai+ |
|
27 |
34 |
49 |
52 |
69 |
231 |
46 |
31 |
|
KOLHAPUR |
|
37 |
34 |
27 |
31 |
53 |
182 |
36 |
110 |
|
AURANGABAD
+ |
|
66 |
50 |
17 |
19 |
13 |
165 |
33 |
153 |
|
NANDED |
|
32 |
19 |
16 |
20 |
21 |
108 |
22 |
80 |
|
PARBHANI+ |
|
21 |
27 |
22 |
27 |
9 |
106 |
21 |
88 |
|
pune+ |
|
38 |
20 |
18 |
15 |
3 |
94 |
19 |
29 |
|
SATARA |
|
20 |
17 |
16 |
19 |
12 |
84 |
17 |
63 |
|
BULDHANA |
|
14 |
14 |
38 |
10 |
7 |
83 |
17 |
79 |
|
osmana |
|
|
|
|
|
|
|
|
61 |
|
jalna |
|
|
|
|
|
|
|
|
52 |
|
|
|
|
|
|
|
|
|
|
|
Chart 3: Faulty reporting ???
|
< dist. |
popln96 |
dowd95 |
dowd96 |
dowd97 |
dowd98 |
dowd99 |
|
SANGLI |
2422 |
14 |
16 |
11 |
11 |
4 |
|
solapur+ |
3595 |
31 |
17 |
16 |
13 |
3 |
|
SATARA |
2685 |
20 |
17 |
16 |
19 |
12 |
|
Pune+ |
6389 |
38 |
20 |
18 |
15 |
3 |
|
AHMEDNAGAR |
3757 |
5 |
2 |
1 |
1 |
0 |
|
|
2161 |
66 |
50 |
17 |
19 |
13 |
|
JALNA |
1567 |
14 |
12 |
5 |
5 |
5 |
|
parbhani+ |
2400 |
21 |
27 |
22 |
27 |
9 |
|
BULDHANA |
2106 |
14 |
14 |
38 |
10 |
7 |
|
amravati+ |
2390 |
11 |
8 |
11 |
20 |
4 |
|
YAVATMAL |
2270 |
5 |
1 |
11 |
12 |
5 |
|
tot of 11 |
|
239 |
184 |
166 |
152 |
65 |
|
all maha |
92727 |
468 |
435 |
413 |
412 |
380 |
|
all-11 |
|
229 |
251 |
247 |
260 |
315 |
|
% of 11 to
all |
|
51.1 |
42.3 |
40.2 |
36.9 |
17.1 |
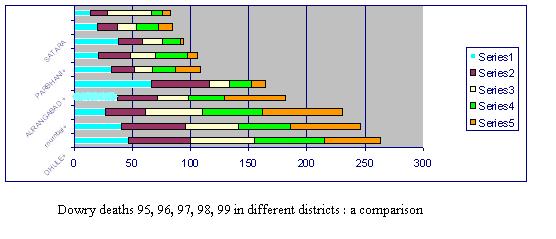


Fig.2, 3, and 4 above are various ways to compare the share of the districts in the total crimes of dowry deaths and their share in the total population of the State. It is found that Latur,
Dhule, Aurangabad, Kolhapur, Parbhani, Nanded, Buldhana and Satara contribute much more to this crime than their share
in the population.
Chart 2 above showed the rate of dowry death per one crore
population and the percentage share of various districts in this rate.
The extremely high rate of dowry deaths in Latur goes beyond all possible justification. In 1992, 15 to 20 villages in Latur suffered unprecedented world scale earthquake killing
more than 50,000 people and devastating huge chunks of land. One expected that such a calamity would
change the mind-set of people and take them away from such greeds
and consumerism as are at the root cause of dowry deaths but the facts as
indicated here are contrary to these expectations. Perhaps it is necessary to see the record of
dowry deaths in the earthquake-hit villages and compare it with the record of
the other villages.
Among all the district, most surprising results are shown by
Dhule
which has highest rate of dowry deaths. Dhule has a large tribal population. Hence there is a need to disaggregate this
data talukawise.
It is also necessary to analyze who are the victims of this crime. It is
noteworthy that the tribals of Dhule
have a better average for land-holdings compared to other tribal districts
where most of the tribals are landless.
It is worthwhile to compare
Marathwada and Nagpur divisions. Nagpur is a
comparatively more developed division with better rating in a variety of
indicators like land holdings, rain fall, good crops, higher literacy rate,
better mineral resources and industrialization etc. The rate of dowry related
crimes in all its districts is much
lower while the rape % are very high as compared to rates in the districts of Marathwada division. What is the sociological factor responsible? One possibility is that increase in educational levels leads to greater
awareness which in turn leads to proper reporting of rape crimes without fearing the social stigma. Another reason was
suggested by a semi –literate, middle –class, rural woman when she read my Marathi article on rape analysis. She argued that
most of the young girls in rural areas are taught that their adult life
will begin and end in ‘chulha’ from which there is no escape. They see
around themselves all elderly ladies going through the same plight whether it
is mother or elder sister or sister- in- law. The only way out seems to be
through education and employment, the search of which often leads to
allurements, temptations and trapping by unscrupulous men and rapes. This
perhaps explains the higher rate of rapes in Nagpur
division or various sex scandals in bigger cities like Jalgaon
and Satara.
If this perception is correct, women today
face a Hobson’s choice. If they are not economically empowered, they face dowry
torture or death within the household. If they seek economic empowerment, they
have to face sexual exploitation or violence outside the household ! Must the
choice before Indian women be so stark?
The preferred situation is where women can
seek economic freedom without fear of violence or stay at home without facing
domestic volence. Alaka Basu’s description (Basu, 1992)of the mother who does not work for economic earning, but knows that work is at hand if the need arises, as being the ‘best placed woman’ will strike a chord among many a women.
But this brings us squarely to the issue of
the rule of law and the efficacy of the system of justice. Only when these
function effectively, can the women be safe whether they choose to work or stay
at home. When these do not function effectively, those who perpetrate violence
on women, and those who see them getting away unpunished, feel emboldened to
torture, to kill, to blackmail or to rape.
The superstructure of economic empowerment therefore rests on the foundation of safety. In a graphical sense, the status
of women rests on three links of a chain, education, safety and availability of
economic opportunity. If all these links are firm then she is secure; if any
one is weak she faces risks. It is useful to remember that a chain snaps at its
weakest link, not at the strongest. The three factors therefore need to link up
together rather than assume competing posture either academically or in terms
of policy. The nature of crime against
women may become a powerful barometer for locating the weak links in different
geographic regions.


comparing dowry deaths and dowry cruelty
Dowry deaths are preceded by dowry cruelties. NCRB reports all provide statistics of these crimes as recorded in each district. chart 4 shows these results.
Similarly fig 6 is the scatter graph to compare the rate of Rape cases Vs Dowry deaths for each district. This is generated from chart 5.


The line graph at Fig 1 shows how the total number of dowry deaths recorded all over the state has continuously declined. It is hard to believe that societal attitudes changed overnight or that the very fact of dowry deaths being monitored by the National Crime records bureau persuaded greedy in-laws into refraining from the crime. Or, was it the impact of the social pressure generated by women activists ? Partly, yes! A friend holding high rank in police had a different explanation.
The crime of dowry death has to be registered and investigated only by a very senior police official, not below the rank of inspector . Once registered, it is also more critically watched by higher officers. It attracts more flack by them than a murder would do. After the very first year, The thana incharges started finding it uncomfortable to register the dowry deaths and then face all questions of the seniors, hence, the decline in subsequent years. If correct, this analysis would be pointing to a very disturbing trend of suppression of facts.
The figures of dowry torture, however, tell a different story. The rate of dowry tortures is quite high in Marathwada , Nagpur and Amravati divisions. This, in a way, raises a doubt about the low figures of dowry death in the two latter divisions.
A continuous watch on this type of statistical information once every year will provide us proper clues to get rid of this menace in time.