Database Visualization
Downloads:Source Code
Contents
-
Lets Begin . . .
-
Flow of the tool
-
Almost Done . . .
Abstract of this Article
When handling a project with hundreds of tables, it takes some time to understand the flows
within the database. Especially so, if there is no document available. A possible scenario is legacy
code up for maintenance or migration. After going through just a few tables, it starts becoming too
cumbersome to maintain the relationships in the mind.This article aims to create a simple tool for
Visualizing database tables and relations, a database map to refer to.
The main aim was to generate the documentation automatically for the database relationships as
and when required. The reason for using the WinGraphViz library was to make sure that the database
relationships did not have much crossings and that the end result looked clutterfree and presentable.
Visualization concepts
"
A picture is worth a thousand words". As the saying goes, it is better to have a picture of any
complex entity to understand it easily. Especially in the areas where a lot of operations are done on
a logical level rather than handling physical objects.Entity relationship diagrams, use case diagrams,
database diagrams, organization hierarchies and even a family tree are candidates for a visualization
method that takes care of laying out the relationships so that they are easily distinguishable.
A good visualization algorithm allows the user to see the pattern that may be difficult or impossible
to see when the same data is presented in a raw form. Such a method is known as a "Planar Graph."
There are 3 main points to note when developing a visualization tool. They are:
- Graph layout
- Interaction with the user and
- Presentation
We are going to use the WinGraphViz library to solve all the above mentioned problems.WinGraphviz
is a free software based on the Graphviz project by AT&T.The graph layout is taken care by the algorithm
and we'll be generating the output in SVG for handling the Interaction and Presentation part.
In graph theory, a planar graph is a graph that can be drawn so that no edges intersect. For those
interested in the details, please download this file.A graph consists of two components: vertices and
edges. Vertices are simply labels such as numbers and edges are the connections between the vertices.
Edges can also have direction which creates a directed graph, or Digraph for short. The WinGraphViz
library attempts to create such a Directed Planar Graph. As it is available as a COM library, we'll
be using
it to create our database visualization tool. For a sample, of what graph optimization can do, check out the
following diagram.
The image was taken from the paper Automatic Graph Drawing. The site also mentions the Automatic Graph
Library or AGD Library for short which can also be used for visualization purposes.
We are going to use a similar graph drawing algorithm to make our output diagram clutterfree and neat.
A note about SVG
SVG is a language for describing two-dimensional graphics and graphical applications in XML.SVG files
are compact and provide high-quality graphics on the Web, in print, and on resource-limited handeld devices.
In addition,SVG supports scripting and animation, so is ideal for interactive graphics. The Adobe SVG Viewer
is free and is available as an ActiveX control which enables us to see the output in a web browser or in a
windows application too. SVG output is highly recommended due to its zooming capabilities. As SVG is
vector based, the clarity of the output would remain constant no matter if you zoomin or zoomout.
Hints about using the Adobe SVG Viewer :
- Use the Ctrl key to Zoom in.
- Use the Shift + Ctrl keys to Zoom out.
- Use the Alt key for panning.
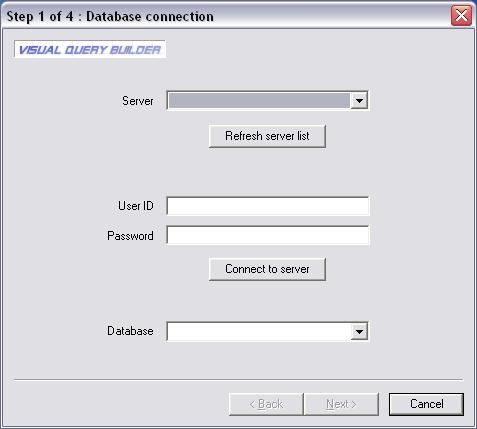
Step 1 : Database Connectivity
To implement this part, we are going to use the "SQLSrvEnumerator" class available here. On selection
of the server combo box, the list of servers available on the network are enumerated and displayed. The
user credentials are obtained to login to the selected server. The list of databases are enumerated and
are automatically populated in a combo box and we are going to select one from the list. The database
connectivity is handled using ODBC here. The remaining operations are done using ADO. Though the
connection can also be done using ADO, i was plainly lazy to change the code after deciding to use
ADO instead of ODBC.
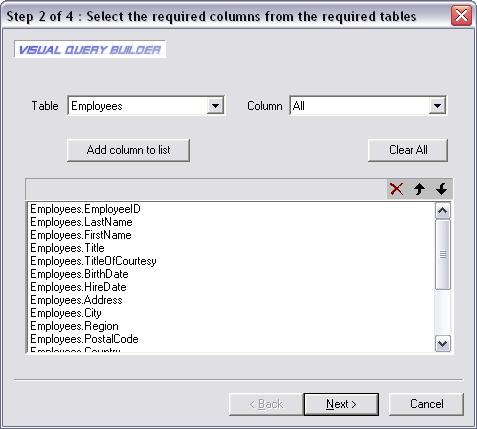
Step 2 : Selecting the needed data
In this simple operation, we are going to select the needed columns. On loading of the page, the
"Tables" combo is automatically populated based on selection of the database in the previous step.
On selecting a table from the list, the "Columns" combo box is populated with all the columns in the
selected table. Selecting the "All" value from the combo, selects all the columns in the table. You can
move the column names up or down based on how we want our diagram to look like. This option is
purely for cosmetic purposes.
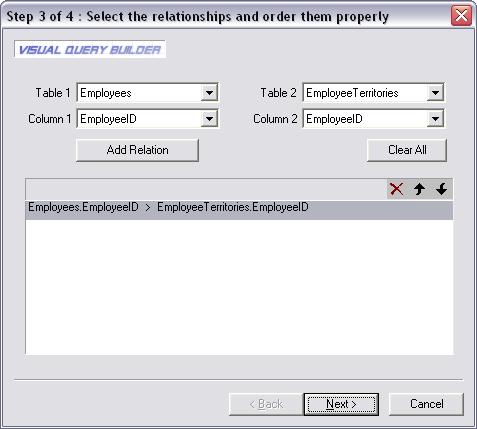
This operation is crucial to how our diagram is generated. We need to select the relationships between
tables
in this step. Select the tables first and select the columns by which they are actually related to each other. For
example, Table1->PK and Table2->FK. The relations entered here are used to generate our visualization.
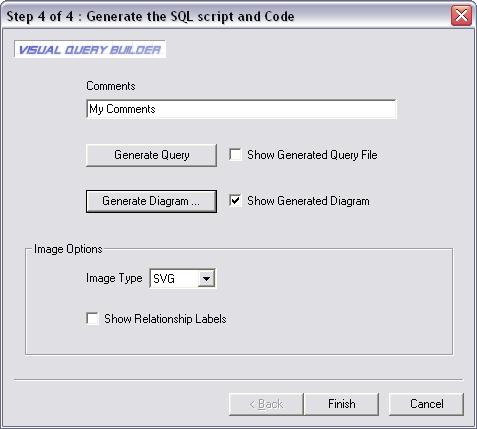
Step 4 : Visualization and Code Generation
We've reached our final step now. You can enter comments if needed. The "Generate Query" button does
exactly what it says. It generates a SQL query based on our selection of tables,columns and relationships. It
generates only a simple query now and in the very first upgrade of this article, i promise to do something better.
It was added as an afterthought as this article only tries to focus on the visualizing part.The "Image Type" combo
supports various image formats such as JPG,SVG,PNG,GIF and EMF. As per your selection, the output diagram
is generated. The "Show Relationship Labels" check box displays the selected relationships in the diagram.
The CVisualization class encapsulates the functionalities of the Graph drawing. The available methods are
void AddComment(CString strComment)
The AddComment function is optional and is used to add a comment in the generated diagram.
void AddTable(CString strTableName,CStringArray &strArrayFields)
The AddTable function takes in the Table name as the first paramater and a String array of field names as the
second parameter. It is used to add the table to the diagram.
void AddLink(CString strNodeOne,CString strNodeTwo,CString strLabel,CString strColor="black")
The AddLink function takes in the Table names as the first 2 paramaters and a String representing the relationship
as the third parameter and the color of the link as the fourth parameter.
BOOL SaveToFile(int nImageFormat,BOOL bOpenFile)
The SaveToFile function takes in the Image format as the first paramater and a boolean variable to determine if the
generated file has to be opened for preview or not.The available options for image format are:
0 for SVG, 1 for JPG, 2 for GIF, 3 for PNG and 4 for EMF.
About WinGraphViz
Download WinGraphViz
A Technique for Drawing Directed Graphs
The Boost Graph Library (BGL)
Graphviz - Graph Visualization Software
The dot guide
Drawing graphs with Graphviz
Automatic Graph Drawing Algorithms
Download Adobe SVG Viewer
SQL Server and Database Enumerator by Santhosh Rao
A VisualStudio-like ListBox class by Stefano Passiglia
The CVisualization class available with the source code encapsulates all the drawing functions and output
functionality needed for our database visualization tool. Please install the Wingraphviz library in order to execute
our tool properly.
Current Limitations
This tool can only handle simple relations. It cannot handle nested Select statements. The method used to
select the tables and the columns are also quite crude. The visualization generated only links the tables and
not the actual keys.
This tool has only been tested with SQL Server 2000 and has not been tested with other databases.
- Handling nested Select statements
- Handling complex relationships
- More visual representation of the table and column selection
- Code generation (Client and Server) based on the selected relationships
- Complex SQL query generation
This tool is not meant to replace the SQL Server Database Diagram Designer. It is only complementary.
In situations where the relationships are not maintained properly in the Database and when a better
visual
representation is needed, this tool can be used. |