 |
|
|
|
|
|
|
|
|
|
|
|
|
|
|
|
|
|
|
|
 |
|
|
|
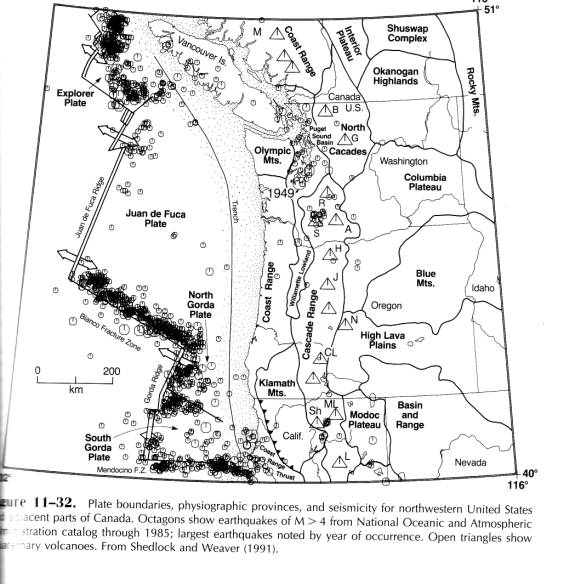
Figure 1.� The illustration shows the various tectonic limitations in the Pacific northwest due to the subducting Juan de Fuca plate.� It also shows the few fragments left over from the previous subducting plate, Falloan.� The fragments from the previous plate are the Explorer plate and Gorda plate (Flueh et al. 1998). |
|
|
|
 |
|
|
| Figure 6.� A cross-section of the Cascadia subduction zone.�� It shows one of the characteristics of the plate system that is worth noting, which is the Juan de Fuca trench, which is the seafloor spreasding zone for the Juan de Fuca plate. |
|
|
|
 |
|
|
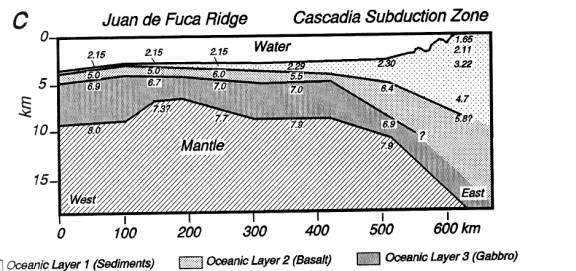
| Figure 4.18.� Section based on the refraction studies of the Juan de Fuca Ridge and the Cascadia Subduction zone off the Oregon coast (Lillie 1999) |
|
|
| Figure 7. ��The refraction studies show that the velocities are about 7.0-7.9 km/s for the mantle in the Cascadia subduction zone.� It also shows that the velocities increase as the depth increases. |
|
|
|
 |
|
|
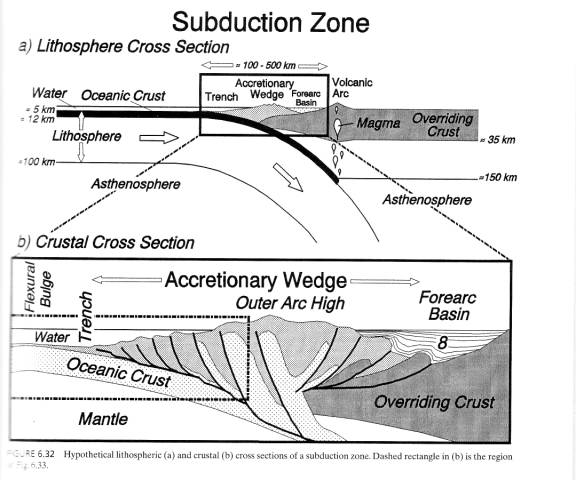
| Figure 8.� Two cross-sections for the same area.� A) a lithosphere cross section. b) a crustal cross-section (Lillie 1999). |
|
|
|
 |
|
|
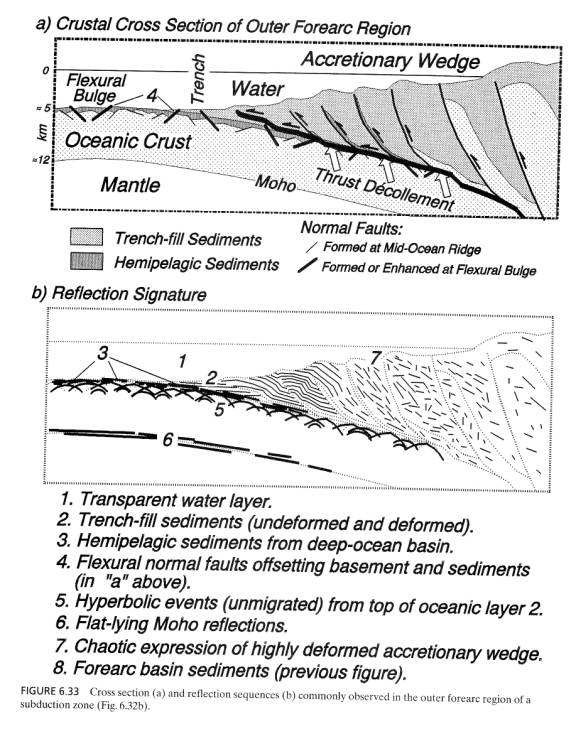
| Figure 9.� Cross-section with its respective reflection sequence (Lillie 1999). |
|
|
 |
|
|
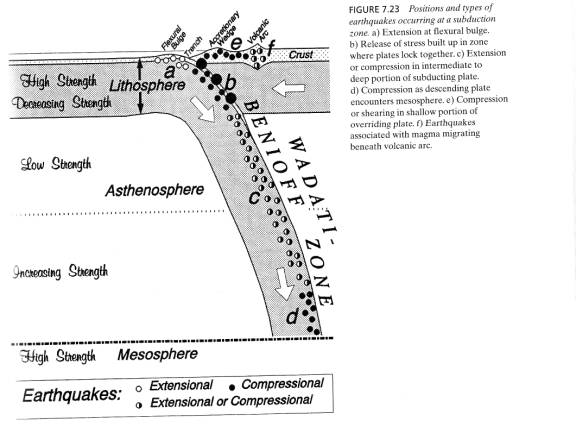
| Figure 10.��� The locations of various types of earthquakes that could occur in the Cascadia subduction zone (Lillie 1999).� |
|