Last updated:January 23, 2008
Calculated Thermal Vibrational Amplitudes of a
Spherical CdS Nanoparticle in a GeO2 Matrix


.....

   Low frequency Raman spectra have been observed for CdS nanoparticles embedded in a GeO2 glass matrix [Tanaka et al. 1993]. [ A. Tanaka. S. Onari and T. Arai "Low-frequency Raman scattering from CdS microcrystals embedded in a germanium dioxide glass matrix." Phys. Rev. B vol 47, page 1237-1243 (1993) ] They saw a low-frequency peak whose frequency scaled as the inverse of the nanoparticle diameter, suggested that it was associated with acoustic vibrational modes of the nanoparticles. A clear, fairly narrow peak was seen over a range of diameters. However this experimental data raised a number of questions. First of all, why should the free sphere vibrational frequencies be relevant given that the nanosphere is fixed in a glass matrix? Second, why did the frequency correspond to the l = 0 spheroidal mode? (that is, the "breathing mode") Why did the l = 2 spheroidal mode (the "football mode") not appear as well (except for a weak vestige in the depolarized spectrum) ?
   To address these questions, I qualitatively estimate the Raman spectrum of a spherical CdS nanoparticle embedded in a GeO2 matrix in the following way: I assume that the vibrations that lead to Raman scattering are as a result of bulk thermal vibrations of the GeO2. Every bulk phonon mode should have the same energy (kBT). The incoming amplitude of the wave at frequency ω is assumed to be independent of ω. I then solve the boundary value problem to get the amplitude of the vibration inside the sphere. There are actually two amplitudes inside the sphere for the case of spheroidal vibrations: A and B. Otherwise (for torsional modes or for the breathing mode) there is a single amplitude inside the sphere, A. These amplitudes are complex numbers. Only the absolute values of these complex numbers are plotted.
   A separate problem which I do not address here is how to calculate the actual Raman spectrum. This is not straighforward since the polarizability of the nanoparticle will change as the nanoparticle vibrates, but it is not clear quantitatively by how much.
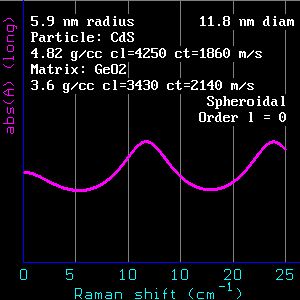
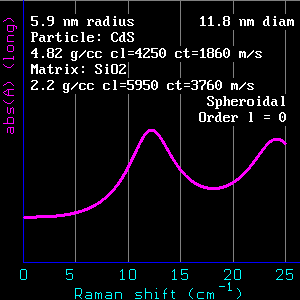
Figure 1: CdS in GeO2
(a) C++ listing: scp69q.c(b) C++ listing: scp67q.c(c)C++ listing: scp67q.c

   Figure 1(a) shows that the l = 0 mode of vibrations has a fairly clear peak around 12 cm-1. This compares to the experimental peak (Figure 3 in Tanaka et al.) at around 10 cm-1. (The fact that the experimental peak is lower can be attributed to dispersion -- lowering of the speed of sound for shorter wavelengths.) The width of the theoretical and experimental peaks are also similar. Figures 1(b) and 1(c) shows the l = 2 spheroidal mode of vibration. Both longitudinal and transverse incident phonons are shown. There is no distinct peak structure.

   Figure 2 shows what happens to the l = 0 mode as the matrix becomes less dense. The peak becomes more and more prominent and sharp. It is interesting to note that the position of the peak does not change as the matrix changes. Only the width of the peak changes.
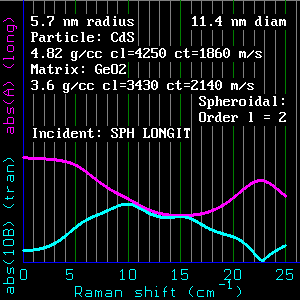
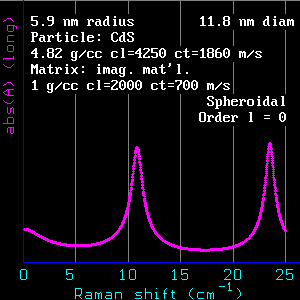
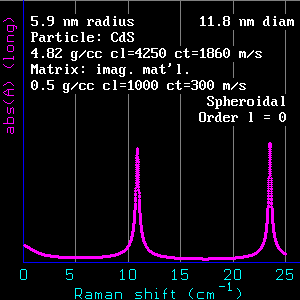
Figure 2. Effect of the matrix on the l = 0 mode
(a)C++ listing: scp69q.c(b)C++ listing: scp69q.c(c)C++ listing: scp69q.c


   Figure 3 shows what happens to the l = 2 spheroidal mode as the matrix becomes less dense. Even though no peak was apparent in the GeO2 matrix, the peak becomes sharper as the matrix becomes less dense. Once again, the position of the peak is not shifted by the presence of the matrix. Only the width of the peak changes.
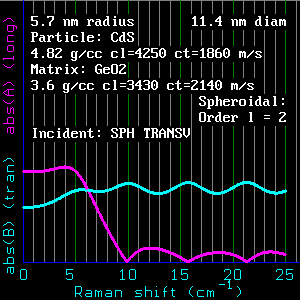
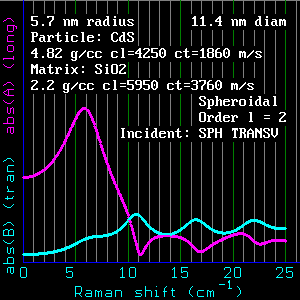
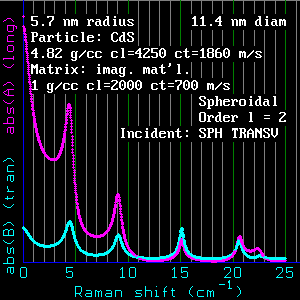
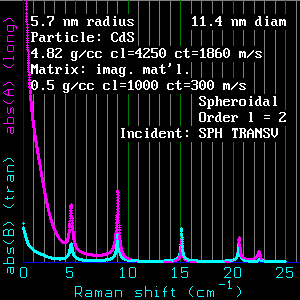
Figure 3: Effect of matrix on the l = 2 spheroidal mode
(a)C++ listing: scp67q.c (b)C++ listing: scp67q.c (c)C++ listing: scp67q.c


Daniel Murray
Associate Professor
Math, Stats & Physics Unit
University of British Columbia - Okanagan
Kelowna, BC, Canada
daniel "dot" murray "at" ubc "dot" ca

For a list of related articles click here.


Hosted by www.Geocities.ws

1