(Return to
Satisfaction Survey Page)
Profile Plots
The following graphs plot the
relationships between the independent variables (age and perception of health
status)
as indicators of the dependent
variable (perception of quality of health care received).
Gender (female and male respondents) is “filtered” to separate
those responses on the plots.
MAGEGRP * OVERALL HEALTH STATUS * MGENDER
Graph 1
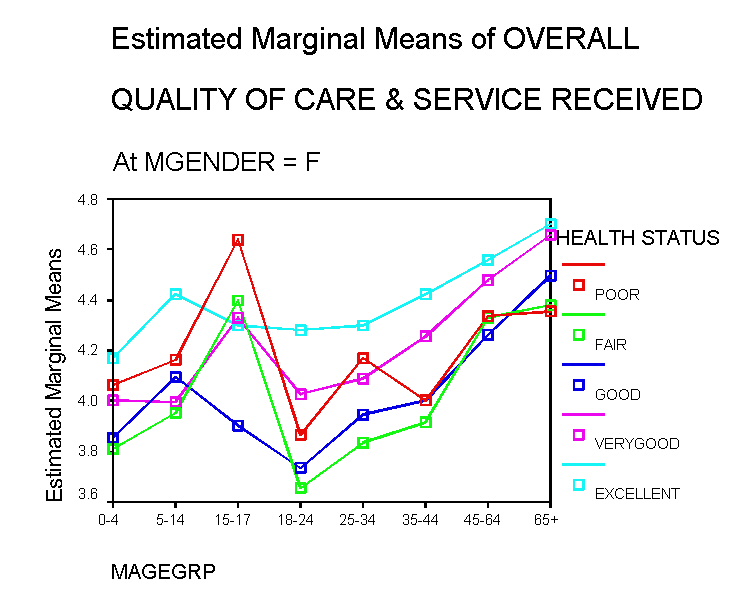
This graphic plot shows that, among female respondents, overall patient satisfaction rises with increasing age.
This trend is evident starting with the 18-24 y/o group.
Graph 2
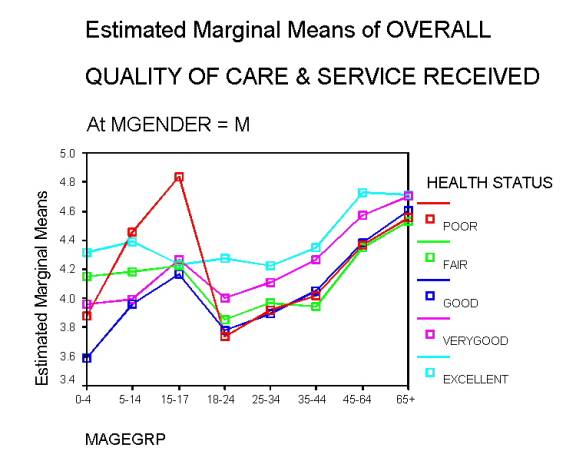
This graph is similar to graph 1. It shows that, among male respondents beyond the 18-24 y/o group,
satisfaction rises as age increases.
(Return to Satisfaction Survey Page)