CHANG NOI
|
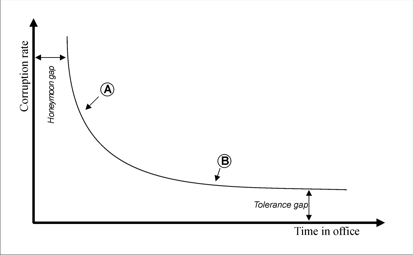
How long do corrupt governments last? 26 November 2002 Almost exactly six years ago (Nation, 3 December 1996), Chang Noi proposed a “corruption curve” showing that corruption affects how long a government lasts. The horizontal axis plots the length of time a government stays in office. The vertical axis shows the corruption rate. This is not a measure in billions of baht. Rather it plots perception: how corrupt people believe the government is. At the top left there is a honeymoon gap. Even if a government is amazingly corrupt, it still lasts a little time because people are always optimistic, and because it takes some time to get a government out. At the bottom right is a tolerance gap. Society is realistic or resigned. It puts up with a certain level of corruption. Towards the upper left (point A), the curve rises very steeply. When a government's corruption rate rises above a certain level, public tolerance drops away rapidly and the government may be driven out. This is the zone of public disgust. Towards the lower right (point B), the curve drops away gently. Quite modest reductions in corruption can greatly extend a government's life expectancy. This is the zone of public comfort. Finally, the position of the curve is affected by the rate of economic growth. If things are going well, the curve shifts outwards. The honeymoon is longer, the tolerance higher, and a government has more staying power. Over the six years since this curve was proposed, several things have changed. The economic crisis severely reduced public tolerance for corruption. The tolerance gap narrowed, and the curve shifted downwards, reducing a corrupt government’s life expectancy. The 1997 constitution sensitised people to corruption issues, and increased optimism that something could be done about. Probably this reduced the honeymoon gap, and made the curve steeper, reducing a corrupt government’s life expectancy still further. But the 1997 constitution also changed things in other ways. It revised the electoral system to engineer bigger parties, and it strengthened the power of the prime minister. It also introduced new methods to remove corrupt ministers and officials without bringing the whole government down. These changes have increased a corrupt government’s life expectancy. Other changes stem from trends in the government budget. In the past, the biggest chunk of the budget (after wages for officials) was capital expenditure—mostly building things. But since the crisis in 1997, capital expenditure’s share of the budget has halved, from about 40 to about 20 per cent. Current expenditure’s share has remained constant. Corruption follows the money. More of the current scandals are about current expenditure. In terms of departments, the budget share for transport, communications and defence has dropped from 35 to 25 per cent. Increases have come in education, health, welfare, and agriculture. These budget shifts have big consequences for the practice of corruption and the public reaction. Making money from the capital expenditure budget has a very simple form: build something at an inflated price and get a kickback. But cheating from current expenditure takes a lot more organisation. Take the scandal over the purchase of medical supplies as an example. A minister had to take a policy decision to make the scam possible. Officials took care of the implementation. A ministerial advisor had the role as enforcer. Companies supplied the medical equipment at inflated prices. And rural hospitals had to accept these inflated prices to make the whole deal work. A lot of people are involved. A lot of circumstantial evidence is lying around. The chance of discovery is high. Several recent scandals have this same pattern. The brilliant extra touch of the compost scam was that if they could get away with it for just a few weeks, the evidence would be dissolved by microbes. The second consequence of the budget shifts is that corruption scandals are more emotive. When the costs of dam construction are inflated, or tanks bought at high prices, our disgust is rather rational. But when the scandals are over school milk, fees for poor workers going overseas, or relief for flood victims, the disgust is more emotional. This has caused two landmark events in the compost scandal. First, the farmers’ organisations have played a major part in bringing the scandal to light, supplying the investigators with evidence, and demanding that serious action be taken. Second, the opposition Democrat Party has investigated the scandal and produced a “Black Book” of findings. In the past, there seemed to be a tacit agreement between political parties not to challenge one another too seriously over corruption for fear of retaliation. That era is now over. What then is the net result of all these changes over the past six years on the corruption curve? The curve has probably shifted outwards, because of the constitution’s strengthening of the executive, and because of the rising economy. But the curve has probably got steeper and lower, because of greater public sensitivity to corruption, higher risks of exposure, and more emotional disgust. If that’s right, then the curve suggests the honeymoon will be longer than in the past, but the crash could be even more sudden. Computers. Job placement fees. Rubber stockpile. Paddy procurement. School milk. Compost for flood relief. Cattle purchases. Longan price support. Government buildings. Expressway tolls. This government is on course to join the list of great scandal-ridden governments: Chatichai, Banharn, Thaksin. But most people probably perceive that this government is not corrupt as a whole. It is just a part. The constitution provides measures to deal with that. Only these are currently being resisted, old-style. It’s time to think new and act new.
|