Example Austin PRT Proposal
This document is meant to be an example only. Any PRT system layout would need considerable
analysis and public involvement before it could be considered a recommended
design. But this example serves to illustrate what may be possible with PRT in
Travis County. Specifically, that even
without transit ridership increase, PRT can reduce the cost of operating the
transit system, and that with reasonably expected ridership increases, the PRT
system could operate with an income.
Route Description
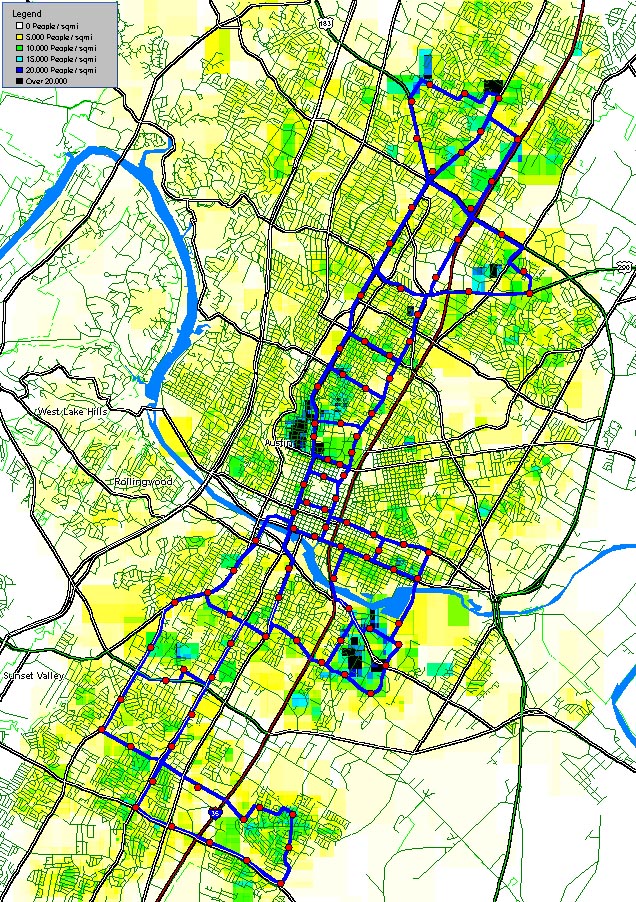
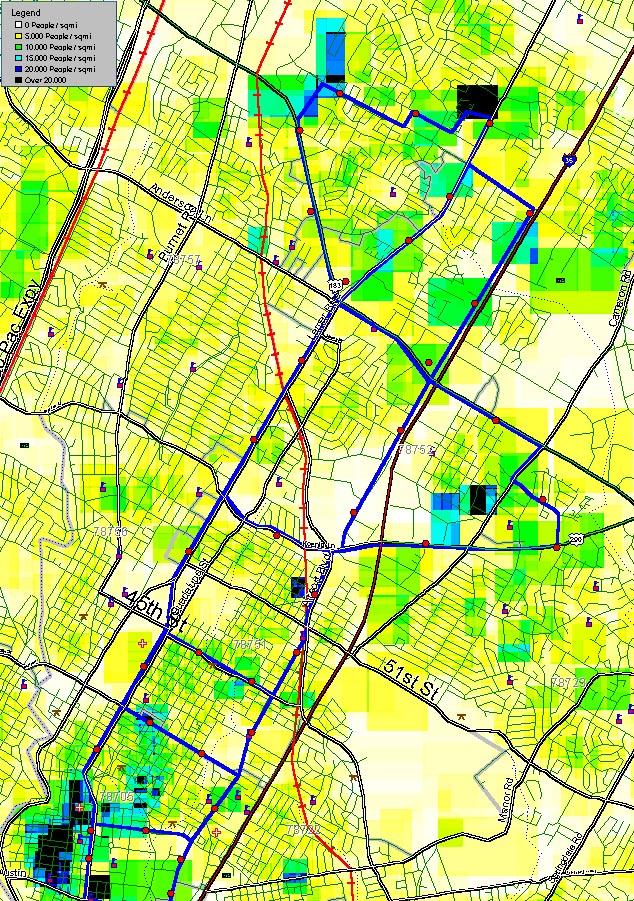
The system consists of 63 miles of guideway and 97 stations. The fastest sections of guideway might be 45 mph non-stop, while downtown guideways would likely be 25 mph non-stop (faster than autos downtown due to auto intersections and traffic). The coverage is so thorough that everywhere in downtown is within 4 blocks of a PRT station.
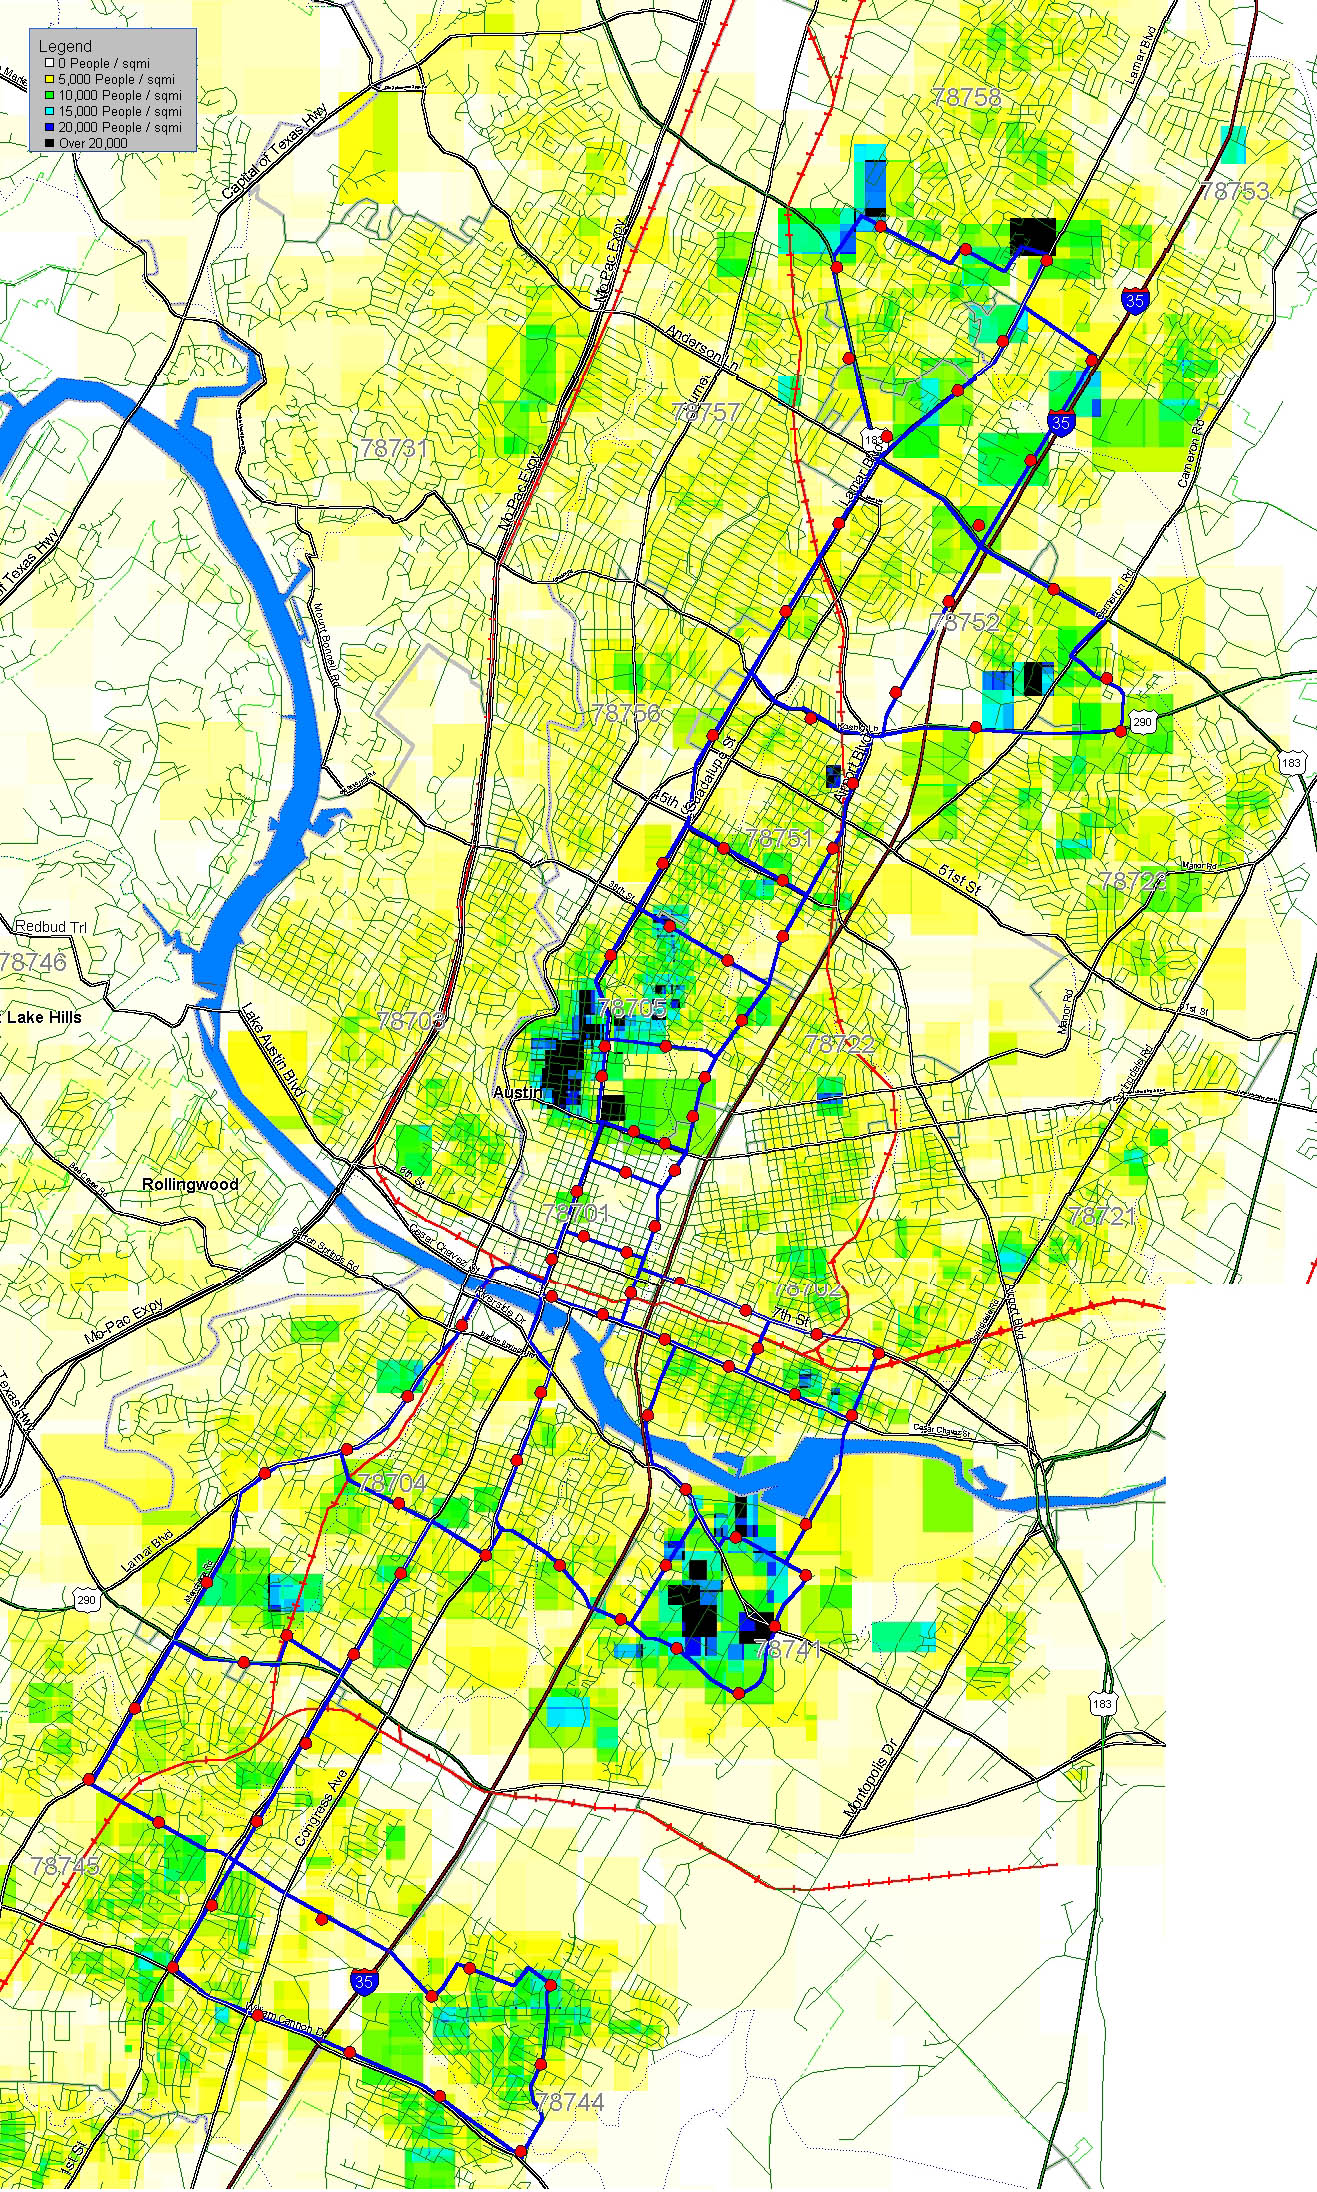
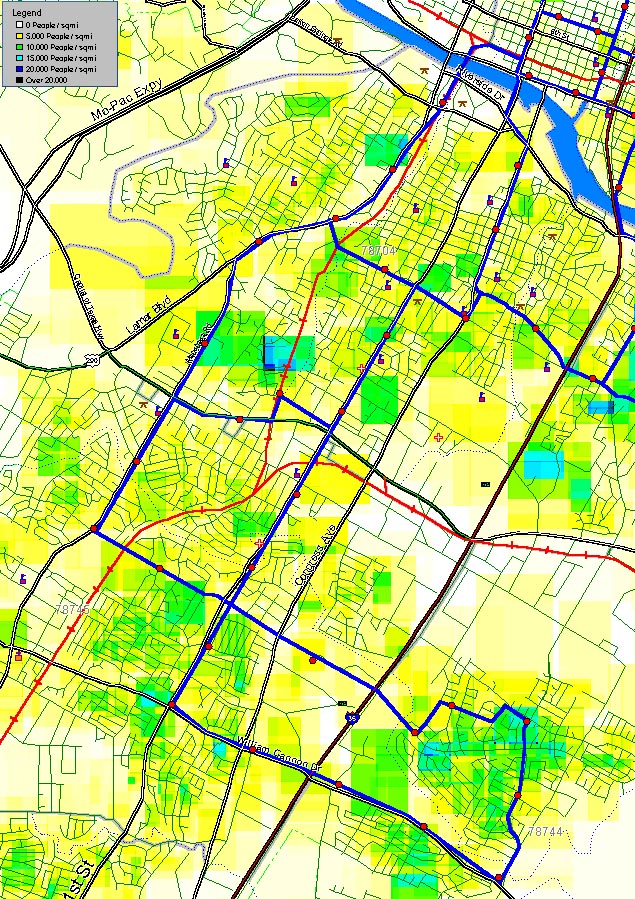
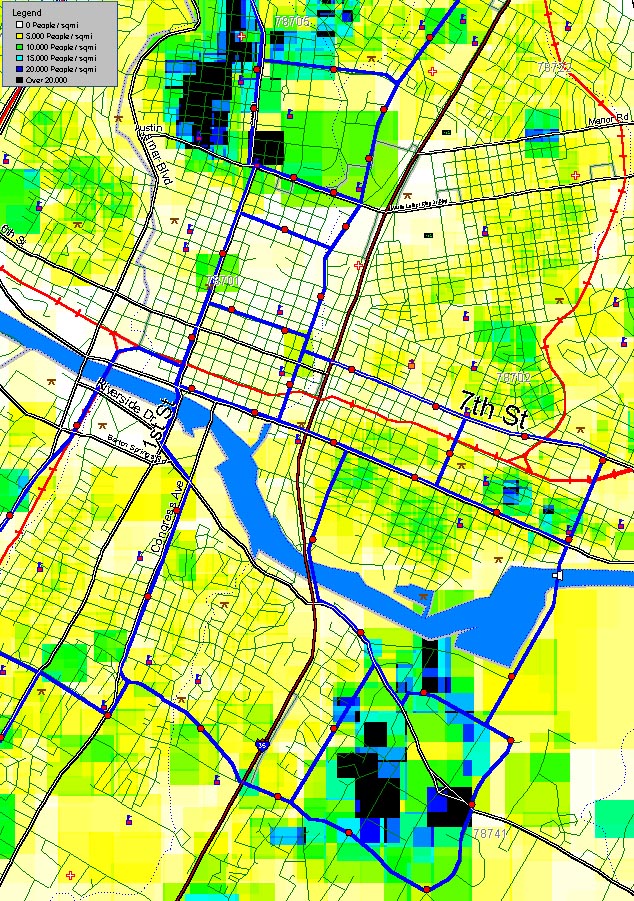
The linked maps below show an overview of the system, and 4 zoned views. Each view shows a background color shading that shows population density based on the 2000 census data. In all the maps the heavy blue line represents the PRT guideway. The Overview map shows only major roads, such as highways, and the PRT guideway. The zoomed views show almost every road and the PRT stations. Please note that Lake Austin and Town Lake are shown in blue. That blue is not part of the density shading (any blue that is not part of the large blue section through the middle of Austin is part of the density shading).
2000 Census Data
The population density color shading
is based on 2000 census block counts.
Using these block counts it was possible to determine that over 175,000
of Austin’s 656,000 residents live within walking distance (0.3 miles) of a
station. That is over one quarter of
all Austin residents and over 21 percent of the Travis county population.
Financial Analysis
There are different PRT
systems. This example uses cost
estimates from Taxi2000 (www.taxi2000.com)
and MegaRail (www.MegaRail.com). To be conservative, we will look at the
higher cost system first (all costing analysis is shown in MS Excel spreadsheets).
With enough vehicles for current bus ridership the
capital cost of this Taxi2000 system is expected to be about $595 million. If federal dollars will cover half the cost,
that leaves $298 million for local financing.
If 6% bonds cover this, the financing cost per year is around $21.6
million (30 year payoff).
An important point is that this
system parallels much of Capital Metro’s current bus service. In fact, about 57% of the bus revenue hours
are with busses operating parallel to these routes. Removing these bus routes would free up over $42 million in
operating cost per year. The operating
cost of this PRT route carrying these 57,800 trips per day would be about $10.7
million per year. Without any change to
the system ridership, user fees, or any new taxes, this PRT system could be
built and operated at a system subsidy reduction of $10 million per year
compared to the current bus system.
When the extra service of the PRT
system is considered, such as 24 hour on demand operation and trip times to
anywhere in the network that is competitive with automobiles, it is likely the
ridership will be twice that of the current bus system or more. The VAL system
in Lille, France is a fully automated system with service every 2 to 6
minutes. Transit ridership in Lille has
doubled while ridership in other French transit systems has declined. This is only one of many studies that
support expected PRT ridership levels of much more than double bus ridership.
The additional operating and financing cost of twice
the ridership is about $4.5 million per year, while additional revenue (assuming
$1 per vehicle trip) would be $14.5 million.
At this level of ridership, the Capital Metro system subsidy would be
$20 million less per year then the current system and service 50% more riders.
At high ridership levels (168,000 one way trips per day) another $10 million
per year is expected, that is, $30 million less system subsidy per year while
servicing 100% more trips!
MegaRail is estimating that their MicroRail system
cost will be even lower than that for Taxi2000. The cost analysis for MicroRail is shown on the second
spreadsheet in the same MS Excel workbook that
shows the Taxi2000 analysis. The cost
to build this PRT route for current bus ridership using MicroRail is estimated
at $261 million. Even without any
Federal funds or new taxes, this system would be $12 million per year less
subsidy than the current bus only transit system. At the high ridership level
and with 50% Federal matching dollars for construction, this system would be $42 million less subsidy per year, and
again, while serving 100% more trips.
Low Risk Approach
To bring PRT to Austin will not require hundreds of
millions of dollars before we have a system that even operates. We can start with a small system that proves
the concept. After the technology of
choice is determined, a small 1 to 3 mile system could be built. Such a system could perform a useful
function and demonstrate the capability.
For example, a one-mile Taxi2000 loop that connects Texas Stadium to
parking across I35 would only cost $10 million, and federal and other grants
may cover most of that cost. Or a 2.6
mile MicroRail loop around UT campus would cost about $6 million and be heavily
used, possible even removing the need for the West Campus and Forty Acers bus
route that operate at a cost of about $1.3 million per year.
After this first section is built and tested, a
revised PRT plan, including updated cost estimates, could be put before the
voters. The voters would then have
first hand knowledge of the system, and the cost estimates would be based on
actual construction experience in Austin.
If it passes the vote, the initial system would be
part of the expansion. The expansion
can also happen in steps. Using
MicroRail cost estimates; the center section can be built for under $70
million, the East for under $25 million, the South for under $90 million and
the North for under $100 million. So not only is the initial loop low risk, the
entire system can be built in segments that need not risk large amounts of
capital dollars.
Conclusion
Personal Rapid Transit may offer a
significant operating cost reduction for the Austin transit system at very low
risk. Further, the level of service
improvements of PRT could double system ridership, reducing operating subsidy
even more while reducing traffic, improving air quality, and in general,
improving the quality of life in Austin.
Map
Images:
Central Austin with East Extension
MS
Excel Calculations:
2002CapMetroBusHoursAndCosts.xls
![]()
![]()