Histograms and Scatterplots
The position of the graphically
represented keys can be found by moving your mouse on top of the graphic.
The
function keys do not count as a row. Hence, row 1 begins with the yellow shift
key.
| Turn your calculator on | |||||||||
| Press
|
|||||||||
| Clearing the memory | |||||||||
| Press
|
|||||||||
| Clearing the Graph Screen | |||||||||
| Entering data | |||
| one variable | |||
|
Type in the first entry in your list and
press
|
|||
| two variables | |||
| Type in the first x-value
in your list and press
|
|||
| Drawing
the Graphs
Warning: Errors occur if the function register has functions in it. See above for instructions on how to clear the function register. |
||||
| Scatterplot | ||||
|
||||
| Histogram | ||||
|
||||
|
Example graphs |
||||||||||||||||
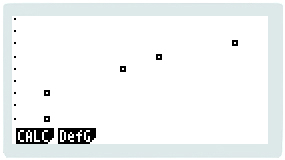
| Scatterplot | ||||||||||||||||
Problem: Make a scatterplot of the
following data:
|
||||||||||||||||
Solution:
|
||||||||||||||||
|
The result should like something like this:
|
||||||||||||||||
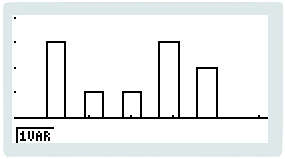
| Histogram | ||||||||||||||||
| Problem: Draw a
histogram of the following data: 5 1 4 1 3 4 1 4 5 2 |
||||||||||||||||
Solution:
|
||||||||||||||||
| The result should look something like this:
|
||||||||||||||||
| Turning the calculator off | ||
|
Press
|
||
Other Casio fx-9960g pages: