A significant problem with firewalls is presenting a huge amount of information in such a way as to allow a person to intemperate the data meaningfully.
With many applications, the data is written out in large text files providing a huge amount of detail, but providing little in the way of generalized patterns.
In addition, an individual less experienced with reading and fingerprinting this data will not be able to see what is important.
In light of this, we implemented an analysis tool based on the excellent A.C.I.D.
console, writing a filter translating the proprietary SunScreen firewall logs into a more general pcap/tcpdump format. Once the
logs are in this format, they can be run through the SNORT intrusion detection engine and put
into a backend database for further reporting.
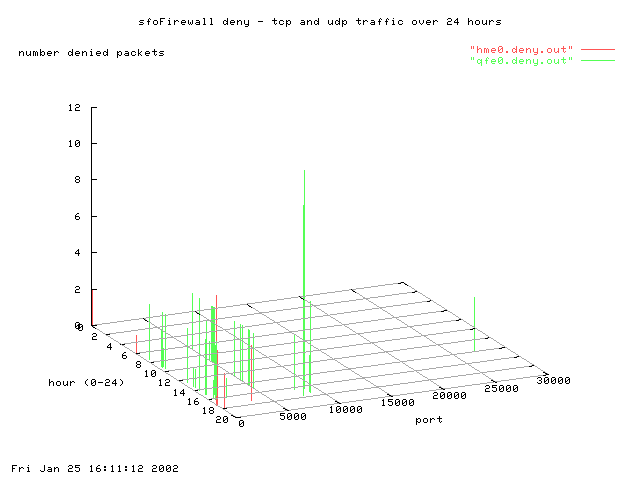
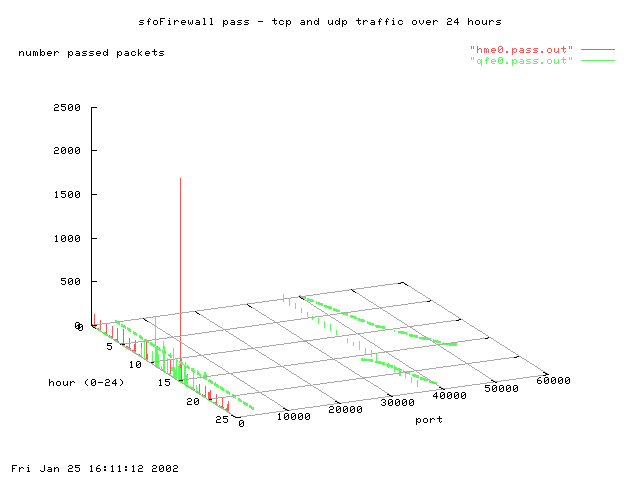
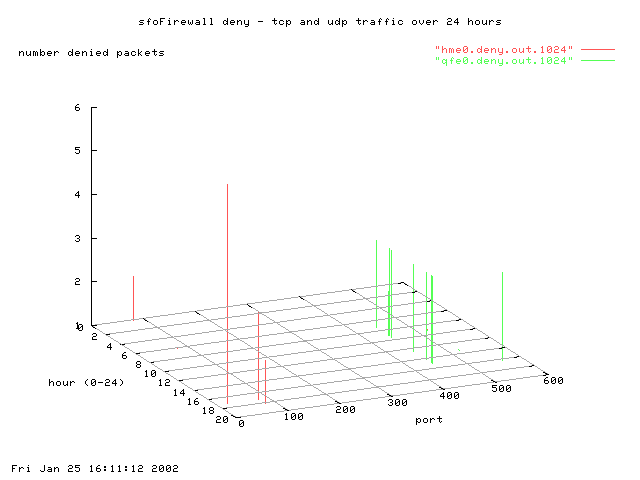
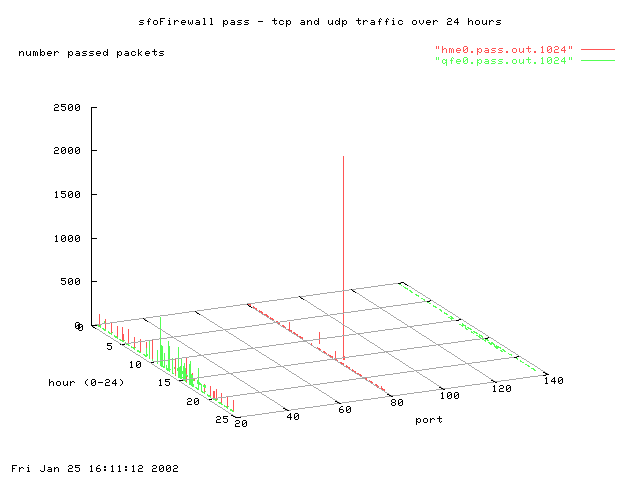
In addition to the log translation and dumping, it seemed prudent to provide a way to show trends (long and short), in the traffic that we are
seeing in the logs. Using a combination of SunScreen log dumping tools, unix sed/awk/egrep functions, and the GNUPlot application,
we were able to generate graphs of whatever data seems important.
Examples are as follows:
|
|
|
|
|
|
|
Sample scripts for creating the above graphs can be found at the bottom of this page. An example of a SunScreen (processed) data file is as follows:
1 hme0 (256: deny rule or no pass rule)2001/08/16 23:11:00.057668 63.150.94.10 -> sfoUserNat WWW C port=3488 |
This data is then processed into files containing time, port, and number via the following script. Please note that the script is more of a proof of concept - there is no error checking or signal trapping.
Once the data is in it's nice collumn format, we run it through GNUPlot with the following script - the output is the nice graphs that you see above. The PNG format of the graphs is nice due to it's un-patent infringing nature. To process the graphs, use the format "gnuplot gnuScript". For more information, look to here for countless good examples for graph representation.![]()