Abstract
Permeability, defined as the ease
with which a fluid may move through a porous medium under an applied pressure
head, is the most important property of concrete governing its long-term
durability. Permeability of concrete, in turn, is influenced by two primary
factors: porosity and pore-interconnectivity in the cement paste and
micro-cracks in the concrete. Porosity
and interconnectivity are controlled for most part by the w/c ratio, degree of
hydration, and the degree of compaction. The level of applied stress, external
or internal, experienced by the concrete, on the other hand, determines density
and location of micro-cracks. Internal stresses in concrete occur as a result
of shrinkage, thermal gradients, abrupt changes in the hygro-thermal
environment and conditions that lead to volumetric instability.
In a previous study, it was demonstrated
that for plain concrete there existed a ‘threshold’ value of stress, below
which a decrease in the water permeability occurred and above which an increase
in the permeability could be expected.
Fiber
reinforcement is known to control cracking resulting from externally applied
loads and adverse environmental factors. It is therefore plausible that fiber
reinforcement will be able to preserve the impermeable nature of concrete and
enhance its durability. A test program was undertaken to verify this hypothesis
and investigate the beneficial effects of fiber reinforcement on long-term
durability of concrete, if any.
Water
permeability tests were carried out on plain and fiber reinforced concrete
specimens carrying 0.1 – 0.5% by volume of cellulose fibers. Two applied stress levels of 30% and 50% of
the ultimate strength (fu) were investigated. At a stress level of 30% fu,
fibers were not seen to play a significant role in reducing the water
permeability. At a higher stress level of 50% fu, on the
other hand, permeability was found to decrease for all fiber dosage rates
investigated. Interestingly, a significant increase in the permeability of
plain concrete was noted at a stress level of 50% fu. Although the beneficial effects of 0.1% and
0.3 % fiber volume fraction were similar, a fiber volume fraction of 0.5% was
clearly seen as the most effective.
Table
of Contents
2. Experimental Technique for Evaluation of
Permeability
List
of Figures
Figure 1 : Schematic Representation
of Water Permeability Setup
Figure 2................ :
Components of Permeability Cell
Figure 3............. :
Components of water Supplying Unit
Figure 4..................... :
Stressed Permeability Cell
Figure 5.................. :
Un-Stressed Permeability Cell
Figure 6..... :
Hollow Core Concrete Cylindrical Specimens
Figure 7 :
Molds used for casting hollow core concrete cylinders
Figure 8............................ :
Removal of PVC core
Figure 9.................. : Samples under miniscule load
Figure 10 : Sample Preparation
Figure 11 :
Permeability Cell Base
Figure 13 : Sample Sitting on Cell Base
Figure 14 : Sample top sealed with Aluminum Cap
Figure 15 :
0 shaped grooves on sample surface to
prevent water leakage
Figure 16 :
Test Setup Showing the Permeability Cell mounted on UTM
Figure 17 :
Compressive Strength Testing Machine
Figure 18 :
Flowchart showing detailed experimental program
Figure 19 : Results for Series 1(a)
Figure 20 :Averaged
results for Series 1(a)
Figure 21 :
Results for Series 1(b)
Figure 22 :
Averaged results for Series 1(b)
Figure 23 :
Results for Series 2(a)
Figure 24 :
Averaged results for Series 2(a)
Figure 25 :
Results for Series 2(b)
Figure 26 :
Averaged results for Series 2(b)
Figure 27 :
Results for Series 3(a)
Figure 28 :
Averaged results for Series 3(a)
Figure 29 :
Results for Series 3(b)
Figure 30 :
Averaged results for Series 3(b)
Figure 31 :
Results for Series 4(a)
Figure 32 :
Averaged results for Series 4(a)
Figure 33 :
Results for Series 4(b)
Figure 34 :
Averaged results for Series 4(b)
Figure 35 : Effect of Fiber Reinforcement
List
of Tables
Table 7: Test Details for Series
1(a)
Table 8: Test Details for Series
1(b)
Table 9: Test Details for Series
2(a)
Table 10: Test Details for Series
2(b)
Table 11: Test Details for Series
3(a)
Table 12: Test Details for Series
3(b)
Table 13: Test Details for Series 4(a)
Table 14: Test Details for Series
4(b)
Table 15: Effect of Fiber
Reinforcement on Permeability of Concrete
The aim of this
research work was to establish the role of cellulose fibers in preserving the
impermeable nature of concrete.
Permeability is one of the most critical properties that control
durability of concrete. It is defined as the movement of fluid through a porous
medium under an applied pressure head; it is in turn governed by two primary
factors:
(a) Porosity and interconnectivity of pores in
the cement paste. These are controlled for most part by w/c ratio, degree of
hydration, and the degree of compaction
(b) Micro cracks in concrete especially at the
paste –aggregate interface. These micro cracks are innate feature of concrete,
they have significant influence on many of its mechanical properties, including
deformation, permeability, and strength.
Density and location
of interfacial micro-cracks, on the other hand, are determined by the level of
applied stress level, external or internal, experienced by the concrete.
Internal stress in concrete occurs as a result of shrinkage, thermal gradients,
abrupt changes in the hygro-thermal environment and
factors causing volumetric instability.
The current work
primarily deals with evaluation of influence of externally applied stress on
the permeability of the fiber reinforced concrete, which has so far remained an
unexplored area. The work done by Hearn [4] on mature concrete revealed no
appreciable effect of stress on the water permeability, on other hand Kermani [7] found that permeability increased significantly
when the stress level exceeded to 40% of the ultimate strength. An essential difference between these two
studies was that Hearn [4] had subjected the specimens to stress prior to
carrying out the permeability tests whereas in Kermani’s
tests [7], permeability tests were carried out in the presence of an applied
stress. However, when Hearn and Lok [5] carried out
nitrogen permeability tests while maintaining a stress on concrete, they too
found that there is a threshold value of stress beyond which increases in the
permeability occurred.
Studies by Banthia et al [3] also revealed that there exists a
‘threshold’ value of stress, below which a decrease in permeability occurs and
above which an increase in permeability can be expected. They also found that
fiber reinforcement could increase this ‘threshold’ stress value [1].
An even greater
increase in permeability is expected if these loads occur at an early age, when
concrete has not yet gained much strength. Early load application, which
routinely occurs in real life, may thus significantly increase the permeability
and produce concrete in service with inadequate durability.
Fiber reinforcement
is known to control cracking resulting from externally applied loads as well
from environmental effects including thermal and shrinkage strains [1].
The purpose of this
research work was to address following issues, role of fibers in preserving
durability concrete and acceptable level of stress on early age fiber
reinforced concrete. The current research is also expected to generate Life
Expectancy Functions (LEFs) for use in Life Cycle Engineering (LCE) Models.
2. Experimental Technique for Evaluation of
Permeability
Depending on the
transport mechanism, test methods for measuring water permeability can be
divided into several categories [6]:
1. Steady State water permeation
2.
3. Capillary suction
Method used for
current purpose was essentially a steady state method. Time taken to obtain steady –state depends
on various factors that includes water to cement ratio, degree of hydration,
age, degree of saturation, thickness and size of the sample.
There is no standard
test for measuring water permeability of FRC under stress; hence an
indigenously built apparatus at UBC was used for measuring steady state water
permeability of concrete samples. Due to reasonable thin sample thickness,
steady state was attained.
Some of the salient features of this apparatus
include:
§
Sample
thickness was 25 mm so that time taken for saturation is less
§
Stress
could be applied while monitoring permeability of samples
§
Wet area
was maximized
§
Constant
hydraulic pressure could be applied to the outside walls while keeping the
inner wall free under atmospheric pressure
The experimental
method employed in this research made use of comparison technique. In each of
the conducted experiments permeability of stressed and unstressed fiber
reinforced concrete specimen was compared.
A schematic
representation of the apparatus for water permeability testing system is shown
in Figure 1. The apparatus primarily
consists of four main parts permeability cells, water supplying unit, measuring
device and universal testing machine for application of load.
Figure 1
: Schematic
Representation of Water Permeability Setup
Permeability cell
consists of squared top and bottom aluminum plate each of length 1400 mm and 45
mm thick, a 160 mm diameter aluminum tube, a 50 mm diameter piston, and a 100
mm diameter aluminum disk, all the components are labeled in Figure 2. All these components were assembled together
by the means of four studs and four nuts. In order to keep the permeability
cells water tight O rings were
installed in the grooves made in top and bottom plate.
Figure 2
:
Components of Permeability Cell
Water supplying unit
consisted of aluminum cylinder with two aluminum plates at its two ends which
are fastened together by means of four studs and four nuts. Again, in order to
keep the cylinder water tight, O rings were installed, inside the grooves made
in top and bottom plate. The driving
pressure was regulated by means of air regulator which controlled air pressure
applied to the cylinder in order to keep the water at a certain level of
pressure head. The pressure head was kept constant through out the progress of
test. All the components of water supplying unit are labeled in Figure 3.
Bottom Plate Aluminum Cylinder Top Plate Air
Pressure Regulator![]()
![]()
![]()
![]()
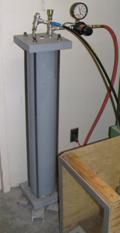
Figure 3
:
Components of water Supplying Unit
Water measuring
device consists of electronic measuring weights connected to the computer.
Drained water is continuously monitored and weight is continuously recorded in
the computer with an accuracy of 0.01 gram.
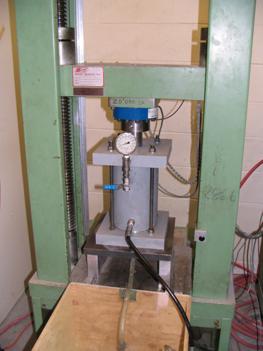
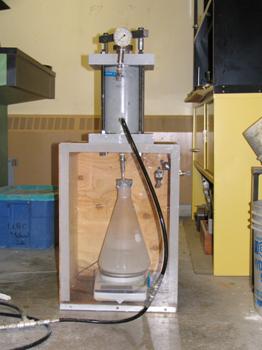
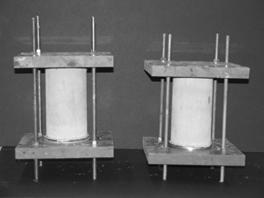
The whole setup
consist of two identical permeability cells, one of the cell is mounted to
universal testing machine [Figure 4] so that a constant level of stress can be
applied on one of the samples, where as other cell is kept out side the UTM
[Figure 5] so that permeability of the unstressed specimen can be monitored at
the same time.
|
Universal Testing Machine Figure 4 :
Stressed Permeability Cell |
Figure 5 :
Un-Stressed Permeability Cell |
Two identical hollow
cylindrical concrete specimens were employed to compare the permeability. In
order to justify the role of fibers in preserving durability of concrete and acceptable level of stress on early age
FRC[1], identical samples with different fiber
volume fraction and under different loads were proposed; and tested. A total of eight test pairs were tested at
age of 7 days to establish the beneficial role of cellulose fibers in early age
concrete. Tables 1 -8 gives the details of test variables.
Table 1:
Test Variable
|
|
Series
1(a) |
Series
1(b) |
||
|
Fiber Volume Fraction |
0.0% |
0.0 % |
||
|
Applied Stress Level |
0 |
0.3fu |
0 |
0.5fu |
Table 2:
Test Variable
|
|
Series
2(a) |
Series
2(b) |
||
|
Fiber Volume Fraction |
0.1% |
0.1 % |
||
|
Applied Stress Level |
0 |
0.3fu |
0 |
0.5fu |
Table 3:
Test Variable
|
|
Series 3(a) |
Series 3(b) |
||
|
Fiber Volume Fraction |
0.3 % |
0.3 % |
||
|
Applied Stress Level |
0 |
0.3fu |
0 |
0.5fu |
Table 4:
Test Variable
|
|
Series 4(a) |
Series 4(b) |
||
|
Fiber Volume Fraction |
0.5% |
0.5 % |
||
|
Applied Stress Level |
0 |
0.3fu |
0 |
0.5fu |
The proportion of
different materials used in this experimental work is given in Table 5. CSA Type 10 normal Portland cement (ASTM Type
1), fly ash, coarse aggregate with a maximum size of 9.5 mm, saturated surface
–dry (SSD) clean river sand with a fineness modulus of about 2.5 and potable
water were used.
Table 5: Mix
Design
|
Materials |
Quantity
(Kg/m3) |
|
Type 10 Portland Cement |
250 |
|
Fly Ash |
100 |
|
Sand |
870 |
|
Gravel 3/8’’ |
870 |
|
Water |
210 |
|
W/C |
0.6 |
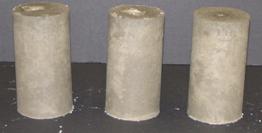
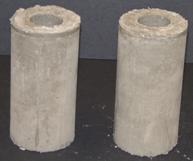
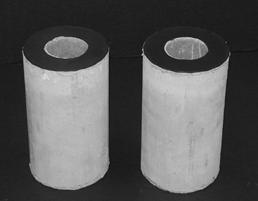
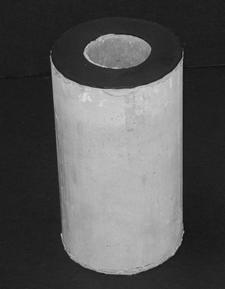
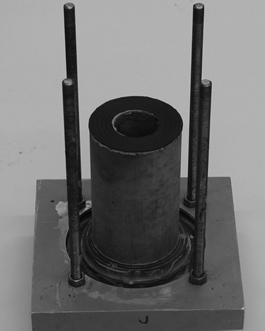
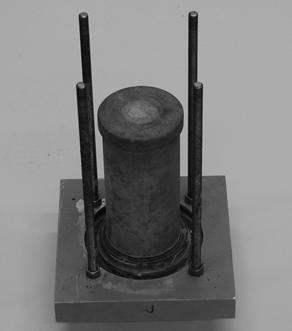
Hollow concrete core
cylindrical specimens were used for the purpose of testing permeability.
Cylindrical concrete specimens with a 100 mm diameter and a height of 200 mm
were casted with a 50 mm diameter hollow
cylindrical core at the center. Figure 6 shows the hollow core concrete
cylindrical specimens.
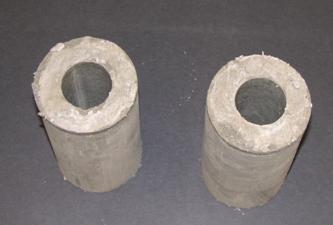
Figure 6
: Hollow
Core Concrete Cylindrical Specimens
In order to evaluate
the strength of casted hollow cylindrical samples, three identical regular
cylindrical samples were casted at the same time as of hollow cylindrical
samples.
To achieve the
specified objective three identical cylindrical specimens of 102 mm (4’’)
diameter and of height 204 mm (8’’) were used to determine the compressive
strength and hollow concrete core cylinder (Figure 6) were used to obtain
permeability of concrete.
Materials listed in
Table 5 were mixed together in a mixer, moisture content of the sand was
measured before mixing and the amount of water was adjusted accordingly to keep
the w/c ratio at 0.6. Fibers were added
after one round of mixing, this composition was allowed to mix for few minutes
and then later water was added followed by mixing of few more minutes till we
obtained a consistent homogenized mixture of the above ingredients.
Three regular
standard cylindrical specimens and two hollow core concrete cylinders were
casted in one batch for each of the proposed experiment. Normal PVC molds were
used for casting regular cylindrical specimens. However two special molds made
at UBC were used for casting hollow core cylindrical specimens. Table 6 gives
the details of dimensions of the specimens used in current research work.
Table 6:
Specimen Details
|
Specimen Type |
Details |
|
|
·
For:
Compressive Strength at 7th Day (as per ASTM C39) ·
Three
per Mix ·
Diameter
= 102mm (4’’) ·
Height
=204mm (8’’) |
|
|
·
For:
Permeability Test at 7th Day ·
Two
per Mix ·
Diameter
= 102mm (4’’) ·
Inside
Diameter=50mm (2’’) ·
Height
=204mm (8’’) |
Figure 7 gives the
details of the molds used for casting hollow core concrete cylinders. These
molds consist of four main parts which includes upper ring, body, core and
base.
Figure 7
: Molds
used for casting hollow core concrete cylinders
Upper ring and core
of the mold were made of PVC, as it is easy to remove while demolding. It is to be noted that for regular
cylindrical molds, oil was used to make demolding easier, but for hollow
cylindrical molds, no lubricant was used in order to prevent the effect of oil
on concrete permeability.
Concrete
consolidation was done using a table vibrator. Casted samples were allowed to
achieve there initial set before covering them with plastic sheets
Demolding was done 24
hours after the casting of the samples. Regular Concrete Cylinders were
demolded using air pressure; however demolding hollow cylindrical specimens was
a dexterous task. Following procedure was adopted to demold
these specimens:
§
PVC core
was removed first using hydraulic pressure as shown in Figure 8 on the
following page.
§
After
removal of PVC core, upper ring was removed gently.
§
Body of
the mold was removed from the base, and then it was turned upside down and was
installed above hollow iron cylinder so that hollow cylindrical specimen could
be removed easily by means of gentle pressure.
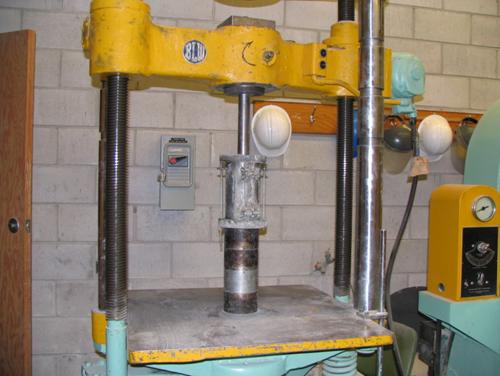
Figure 8
: Removal
of PVC core
After demolding of
samples, they were kept in saturated lime water bath until the day of testing.
One of the most
critical parts of test was preparation of sample, as it essentially decides
success of the test. Leakage of water
was essentially controlled by the success of sample preparation.
To prepare samples
for the test, they were removed from saturated lime water tank after 6 days of
curing. They were then grinded till two smooth flat parallel surfaces were
obtained at both the ends of the samples. These grinded samples were then left
for couple of hours for drying.
In permeability
tests, boundary leakage through sample is a critical issue, hence key
requirement is to prevent leakage through sample boundary, which is in this
case was done using rubber rings with an outer diameter of 4’’ and an inner
diameter of 2’’. These rings were placed on the dried clean surface of samples
using a silicone building sealant. DOW CORING 790 was used as a silicone
building sealant. Samples were left for 12 hours of drying after installation
of rubber rings using silicone building sealant. Upon application of sealant
and installation of rubber rings on the surface, these samples were left under
small load so that rubbers rings sticks well to the concrete surface as shown
in Figure 9. Final prepared samples are shown in Figure 10.
|
|
|
|
Figure 9 : Samples under
miniscule load |
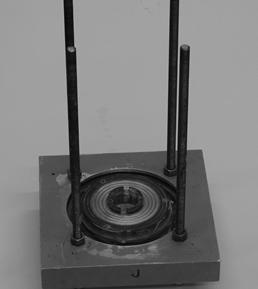
After sample
preparation, dried sample were placed tightly on permeability cell base, as
shown in Figure 11 -14.
|
|
|
|
|
|
|
Figure 13
: Sample Sitting on Cell Base |
Figure 14
:
Sample top sealed with Aluminum Cap |
As shown in Figure
14, the aluminum disk was tightly fitted on sample top to prevent any leakage
of water through sample base and top. It is be to be noted that O shaped
grooves were made on the cell base and aluminum cap so that when it is pressed
hard against the rubber installed on sample surface it makes 0 shaped grooves
on rubber surface, to prevent any undue leakage through sample surfaces. Figure
15 shows the formation of 0 rings on
rubber surface of prepared samples.
After installation of
sample on cell base, main tube made up of aluminum was fitted tightly on cell
base, a small amount of oil was applied on tube surface so that it could be
removed easily after permeability test.
There after top plate was secured tightly on main tube, it was clamped
tightly in order to squeeze the upper disk on sample surface, so that O rings as shown in Figure 15 are
formed. All the cell components were tightly secured together by four studs and
nuts.
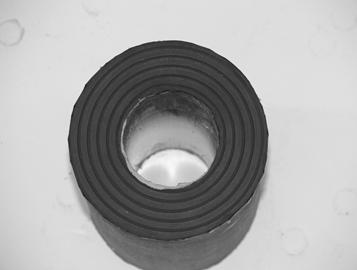
Figure 15
: 0 shaped grooves on sample surface to prevent water leakage
The whole assembly
was mounted in a testing machine where a certain compressive stress could be
applied on the specimen during the test. Two identical cells were used: one
under stress in the Universal Testing
Machine as shown in Figure 4 and the other outside of the machine with no
stress as shown in Figure 5. Finally, the water supply pipes were connected to
the cells as shown in Figure 16.
Figure 16
: Test
Setup Showing the Permeability Cell mounted on UTM
The final step before
starting test was determination of compressive stress to be applied on
specimens, as mentioned earlier compressive stress of 30% and 50% of the
ultimate strength was applied on the specimens from each series, to study the
effect of stress on permeability of early age FRC. Compressive strength of
samples was determined by crushing three samples from each batch. Figure 17
shows the compression testing machine with a capacity of 600, 000 lbs (2659 KN)
used in the current research work. Compressive strength tests were done in
harmony with ASTM C 39 -96.
Sample Compressive Strength![]()
![]()
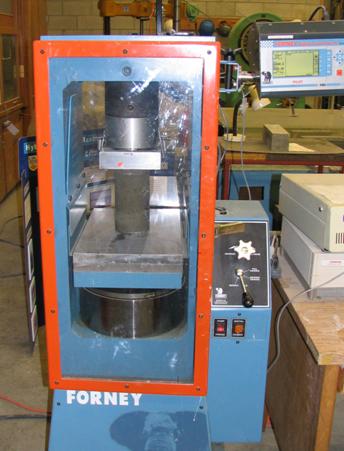
Figure 17
: Compressive Strength
Testing Machine
A test age of 7 days
was selected through out, anticipating that at an age of 7 days, in all
instances, secondary loads occur on concrete structures, and primary loads
occur in most instances. Each of the test pairs was tested at an age of 7 days
for about 30 hours after the equilibrium conditions was attained.
The specimens were
placed in a specially designed cell as explained above such that water
permeated under a pressure of 0.48 MPa through the 25 mm thick outer wall and
was collected in the inner hollow core.
The hydraulic
pressure was applied to the outside wall of the hollow cylinder. The driving
pressure was controlled by a regulator and kept constant throughout the test
and a calibrated pressure gauge was used to indicate the inflow pressure.
Extreme caution was exercised to detect any leakage in the system.
The collected water
in the hollow core was then drained out to a collection reservoir where its
mass was measured continuously and accurately using a computer controlled scale
as shown in Figure 16. Load relaxation occurred in the machine with time, and
the drop in load was corrected by moving the loading arm downward.
Using Darcy’s law,
coefficient of water permeability (Kw) of concrete
specimens under steady state condition can be determined using following
equation:
Kw =![]() (1)
(1)
where:
Kw – Coefficient of Water Permeability (m/s)
Q – Rate of water Flow (m3/sec)
L – Thickness of
Specimen Wall (m)
A- Permeation Area (m2)
Δh- Pressure head (m)
The whole
experimental program was divided into four series of tests, based on fiber
volume fractions. Each series of test was further subdivided into two
sub-series of tests based on percentage of ultimate load to be applied on
specimens as shown in Figure 18
Figure 18
: Flowchart
showing detailed experimental program
Results for Series 1 (a): Plain concrete specimens were tested for
permeability; two identical specimens were tested at an age of 7 Days, one
under a stress of 0.3 fu and another identical specimen under zero
stress. Same experiment was done twice to obtain consistent information.
Permeability was observed to decrease by a factor of about 0.3 under 30% of ultimate strength as compared to unstressed
specimen. Table 7 gives the information of test variable for this series of
Test. Figure 19 shows the test results for this series where as Figure 20 shows
the averaged results for the same series.
Table 7:
Test Details for Series 1(a)
|
Series
1 (a) |
Specimen
Age (Days) |
Compressive
Strength (fu) (MPa) |
Driving
Pressure (MPa) |
Date
of Test |
Applied
Stress Level (MPa) 0.3fu |
|
S1(a) |
7 |
17.59 |
0.48 |
Sep 18, 05 |
5.28 |
|
S’1(a) |
7 |
19.53 |
0.48 |
Sep 17, 05 |
5.86 |
Figure 19
: Results for Series 1(a)
Figure 20
:Averaged
results for Series 1(a)
Results for Series 1 (b): In this series plain concrete specimens were
tested, stressed specimens carried a stress of 0.5 fu. At a stress
level of 50% of the ultimate strength permeability of the stressed specimen was
found to increase by a factor of 1.38. Experiment was repeated
twice to obtain consistent information and permeability was found to increase
by approximately same factor. Table 8 gives the information of test variable
for this series of Test. Figure 21 shows the test results for this series where
as Figure 22 shows the averaged results for the same series.
Table 8: Test
Details for Series 1(b)
|
Series
1 (b) |
Specimen
Age (Days) |
Compressive
Strength (fu) (MPa) |
Driving
Pressure (MPa) |
Date
of Test |
Applied
Stress Level (MPa) 0.5fu |
|
S1(b) |
7 |
17.11 |
0.48 |
July 04, 05 |
8.55 |
|
S’1(b) |
7 |
22.85 |
0.48 |
July 08, 05 |
11.42 |
Figure 21
: Results for Series 1(b)
Figure 22
: Averaged
results for Series 1(b)
Results for Series 2 (a): Permeability
of concrete was tested using 0.1% cellulose fiber, two identical specimens were
tested at an age of 7 Days, one under stress level of 0.3 fu and
another identical specimen under zero stress. Same experiment was done thrice
to obtain consistent information, but lot of variability was observed in the
data. Table 9 gives the information of test variables. Figure 23 shows the test
results for this series where as Figure 24 shows the averaged results for the
same series.
Permeability was
observed to increase in initial few hours followed by sudden decrease in the
permeability value relative to the permeability of unstressed specimen.
Table 9: Test
Details for Series 2(a)
|
Series
2 (a) |
Specimen
Age (Days) |
Compressive
Strength (fu) (MPa) |
Driving
Pressure (MPa) |
Date
of Test |
Applied
Stress Level (MPa) 0.3fu |
|
S2(a) |
7 |
21.04 |
0.48 |
Sep 11, 05 |
6.31 |
|
S’2(a) |
7 |
19.42 |
0.48 |
Sep12, 05 |
5.82 |
|
S’’2(a) |
7 |
17.20 |
0.48 |
Sep 15, 05 |
5.16 |
Figure 23
: Results
for Series 2(a)
Figure 24
: Averaged results for
Series 2(a)
Results for Series 2 (b): In this case also permeability of concrete was tested using 0.1% cellulose fiber;
two identical specimens were tested at an age of 7 Days, one under stress level
of 0.5 fu and another identical specimen under zero stress. Same
experiment was done twice to obtain consistent information. Permeability of stressed specimen decreased
relative to permeability of unstressed specimen by a factor of 0.75. Table 10 gives the information of test
variables. Figure 25 shows the test results for this series where as Figure 26
shows the averaged results for the same series.
Table 10:
Test Details for Series 2(b)
|
Series
2 (a) |
Specimen
Age (Days) |
Compressive
Strength (fu) (MPa) |
Driving
Pressure (MPa) |
Date
of Test |
Applied
Stress Level (MPa) 0.5fu |
|
S2(a) |
7 |
19..99 |
0.48 |
Sep 05, 05 |
9.99 |
|
S’’2(a) |
7 |
17.81 |
0.48 |
Sep 12, 05 |
8.90 |
Figure 25
: Results
for Series 2(b)
Figure 26
: Averaged results for
Series 2(b)
Results for Series 3 (a): Fiber
reinforced concrete specimens with fiber volume fraction of 0.3% were tested
for permeability; two identical specimens were tested at an age of 7 days, one
under a stress of 0.3fu and another identical specimen under zero
stress. Same experiment was done twice to obtain consistent information.
Permeability was observed to decrease by a factor of about 0.55 under 30% of ultimate strength as compared to permeability of
unstressed specimen. Table 11 gives the information of test variable for this
series of Test. Figure 27 shows the test results for this series where as
Figure 28 shows the averaged results for the same series.
Table 11:
Test Details for Series 3(a)
|
Series
3 (a) |
Specimen
Age (Days) |
Compressive
Strength (fu) (MPa) |
Driving
Pressure (MPa) |
Date
of Test |
Applied
Stress Level (MPa) 0.3fu |
|
S3(a) |
7 |
20.32 |
0.48 |
Aug 09, 05 |
6.09 |
|
S’3(a) |
7 |
20.06 |
0.48 |
Aug 11, 05 |
6.02 |
Figure 27
: Results for Series 3(a)
Figure 28
: Averaged results for
Series 3(a)
Results for Series 3 (b): In
this series concrete specimen with a fiber volume fraction of 0.3% was tested,
stressed specimens carried a stress of 0.5 fu. At a stress level of
50% of the ultimate strength permeability of the stressed specimen was found to
decrease by a factor of 0.76. Experiment was repeated twice to obtain consistent
information; permeability was found to decrease by approximately same factor.
Table 12 gives the information of test variable for this series of Test. Figure
29 shows the test results for this series where as Figure 30 shows the averaged
results for the same series.
Table 12:
Test Details for Series 3(b)
|
Series
3 (b) |
Specimen
Age (Days) |
Compressive
Strength (fu) (MPa) |
Driving
Pressure (MPa) |
Date
of Test |
Applied
Stress Level (MPa) 0.5fu |
|
S3(b) |
7 |
17.75 |
0.48 |
July 28, 05 |
8.87 |
|
S’3(b) |
7 |
19.18 |
0.48 |
July 29, 05 |
9.59 |
Figure 29
: Results
for Series 3(b)
Figure 30
: Averaged results for
Series 3(b)
Results for Series 4 (a): Fiber
reinforced concrete specimens with fiber volume fraction of 0.5% were tested
for permeability; two identical specimens were tested at an age of 7 days, one
under a stress of 0.3 fu and another identical specimen under zero
stress. Same experiment was done twice to obtain consistent information.
Permeability was observed to decrease
by a factor of about 0.44 under 30%
of ultimate strength as compared to permeability of unstressed specimen. Table
13 gives the information of test variable for this series of Test. Figure 31
shows the test results for this series where as Figure 32 shows the averaged
results for the same series.
Table 13: Test
Details for Series 4(a)
|
Series
4 (a) |
Specimen
Age (Days) |
Compressive
Strength (fu) (MPa) |
Driving
Pressure (MPa) |
Date
of Test |
Applied
Stress Level (MPa) 0.3fu |
|
S4(a) |
7 |
17.67 |
0.48 |
Sep 05, 05 |
5.30 |
|
S’4(a) |
7 |
17.52 |
0.48 |
Sep 08, 05 |
5.28 |
|
S’’4(a) |
7 |
20.12 |
0.48 |
Sep 12, 05 |
6.03 |
Figure 31
: Results for Series 4(a)

Figure 32
: Averaged results for
Series 4(a)
Results for Series 4(b): In
this series concrete specimen using a fiber volume fraction of 0.5% was tested,
stressed specimens carried a stress of 0.5 fu. At a stress level of
50% of the ultimate strength, permeability of the stressed specimen was found
to decrease by a factor of 0.62. Experiment was repeated twice to obtain consistent
information and permeability was found to decrease by approximately same
factor. Table 14 gives the information of test variable for this series of
Test. Figure 33 shows the test results for this series where as Figure 34 shows
the averaged results for same the series.
Table 14:
Test Details for Series 4(b)
|
Series
4 (b) |
Specimen
Age (Days) |
Compressive
Strength (fu) (MPa) |
Driving
Pressure (MPa) |
Date
of Test |
Applied
Stress Level (MPa) 0.5fu |
|
S4(b) |
7 |
17.06 |
0.48 |
June 30, 05 |
8.53 |
|
S’4(b) |
7 |
17.33 |
0.48 |
July 02, 05 |
8.66 |
Figure 33
: Results for Series 4(b)
Figure 34
: Averaged results for
Series 4 (b)
Cellulose fiber
reinforcement proved to be beneficial in preserving permeability of stressed
concrete. At a stress level of 50% fu permeability was found to
decrease at all level of fiber volume fractions that is at (0.1%, 0.3% and
0.5%). Though, 0.1 % and 0.3 % fiber volume fraction had same effect at a
stress level of 50% of the ultimate strength of the tested sample, 0.5% fiber
had more pronounced effect in preserving permeability of concrete.
At a stress level of
30% fu effect of fibers was
ambiguous, which indicates that at this stress level fibers do not play
significant role in reducing water permeability of the concrete. Table 15 and
Figure 35 show the effect of fibers at varying stress level.
Table 15:
Effect of Fiber Reinforcement on Permeability of Concrete
|
Stress
Level |
Fiber
Volume Fraction |
|||
|
0% |
0.1% |
0.3% |
0.5% |
|
|
0% |
1 |
1 |
1 |
1 |
|
30% |
0.29 |
0.68 |
0.55 |
0.44 |
|
50% |
1.38 |
0.75 |
0.76 |
0.62 |
Figure 35
: Effect of Fiber Reinforcement
[1.]
Banthia, N., Biparva, A.,
and Mindess S., Permeability of Stressed Concrete,
Cement and Concrete Research, in press, 2005.
[2.]
Banthia, N. and Mindess,
S., Water Permeability of Cement Paste, Cement & Concrete Research (
[3.]
Banthia, N., Pigeon, M., Marchand,
J. and Boisvert, J., Permeability of Roller Compacted
Concrete, ASCE J. of Materials in Civil Eng. , 4(1), 1992, pp. 27-40.
[4.]
Hearn, N.,
Effect of Shrinkage and Load Induced Cracking on Water Permeability of
Concrete, ACI Materials J., 96(6), 1999, pp. 234-241.
[5.]
Hearn, N.
and Lok, B., Measurement of Permeability Under Uniaxial Compression—A Test Method, ACI Materials J. 95(6),
1998, pp. 691-694.
[6.]
J. Kropp and H. K. Hilsdorf,
“Performance criteria for concrete durability”, Rilem
report 12, (1992).
[7.]
Kermani, A., Permeability of Stressed Concrete,
Building Research and Information, 19(6),1991, pp. 360-366
[8.]
Mehta, P.
Kumar and Monteiro, Paulo J.M., Concrete Structure,
Properties, and Materials, Prentice Hall, Second Edition, 1993.