Volcano Monitoring and Research
History
of volcanology
It
has been said that the science of "volcanology" originated with the
accurate descriptions of the eruption of Vesuvius in A.D. 79 contained in two
letters from Pliny the Younger to the Roman historian Tacitus. Pliny's letters
also described the death of his uncle, Pliny the Elder, who was killed in the
eruption. Actually, however, it was not until the 19th century that serious
scientific inquiry into volcanic phenomena flourished as part of the general
revolution in the physical and life sciences, including the new science of
"geology." In 1847, an observatory was established on the flanks of
Vesuvius, upslope from the site of Herculaneum, for the more or less continuous
recording of the activity of the volcano that destroyed the city in A.D. 79.
Still, through the first decade of the 20th century, the study of volcanoes by
and large continued to be of an expeditionary nature, generally undertaken after
the eruption had begun or the activity had ceased.
Perhaps
"modern" volcanology began in 1912, when Thomas A. Jaggar, Head of the
Geology Department of the Massachusetts Institute of Technology, founded the
Hawaiian Volcano Observatory (HVO), located on the rim of Kilauea's caldera.
Initially supported by an association of Honolulu businessmen, HVO began to
conduct systematic and continuous monitoring of seismic activity preceding,
accompanying, and following eruptions, as well as a wide variety of other
geological, geophysical, and geochemical observations and investigations.
Between 1919 and 1948, HVO was administered by various Federal agencies
 (National Weather Service, U.S. Geological Survey, and National Park Service),
and since 1948 it has been operated continuously by the Geological Survey as
part of its Volcano Hazards Program. The more than 75 years of comprehensive
investigations by HVO and other scientists in Hawaii have added substantially to
our understanding of the eruptive mechanisms of Kilauea and Mauna Loa, two of
the world's most active volcanoes. Moreover, the Hawaiian Volcano Observatory
pioneered and refined most of the commonly used volcano-monitoring techniques
presently employed by other observatories monitoring active volcanoes elsewhere,
principally in Indonesia, Italy, Japan, Latin America, New Zealand, Lesser
Antilles (Caribbean), Philippines, and Kamchatka (Russia).
(National Weather Service, U.S. Geological Survey, and National Park Service),
and since 1948 it has been operated continuously by the Geological Survey as
part of its Volcano Hazards Program. The more than 75 years of comprehensive
investigations by HVO and other scientists in Hawaii have added substantially to
our understanding of the eruptive mechanisms of Kilauea and Mauna Loa, two of
the world's most active volcanoes. Moreover, the Hawaiian Volcano Observatory
pioneered and refined most of the commonly used volcano-monitoring techniques
presently employed by other observatories monitoring active volcanoes elsewhere,
principally in Indonesia, Italy, Japan, Latin America, New Zealand, Lesser
Antilles (Caribbean), Philippines, and Kamchatka (Russia).
The
U.S. Geological Survey's Hawaiian Volcano Observatory, on the crater rim
of Kilauea Volcano.
The World
Organization of Volcano Observatories was established as the result of a
meeting of representatives from world-wide volcano observatories, held in
Guadeloupe in 1981. WOVO became International Association of Volcanology and
Chemistry of the Earth's Interior Commission in the following year. The principal aims of the World Organization of Volcano
Observatories are:
- To stimulate cooperation between
scientists working in observatories and to create or improve ties between
observatories and institutions directly involved in volcano monitoring.
- To facilitate an exchange of
views and experience in volcano monitoring by convening periodic meetings
including field-based ones, by periodic newsletters, and by promoting a
specific e-mail observatories network service.
- To maintain an up-to-date
inventory (Directory of Volcano Observatories) of networks and of
instrumentation and manpower that could be made available to any of the
member institutions if a situation arises that requires scientific support.
- To supply technical support at
observatories in developing countries and to create a WOVO fund to be used
by these observatories (activities of WOVO generally speaking are focused on
dangerous volcanoes in developing countries).
- To organise an international task
force and to promote funding from international organisations that could
help defray travel and related expenses of scientific support teams.
A
strikingly successful example of volcano research and volcanic hazard assessment
was the 1978 publication (Bulletin 1383-C) by two Geological Survey scientists,
Dwight Crandell and Donal Mullineaux, who concluded that Mount St. Helens was
the Cascade volcano most frequently active in the past 4,500 years and the one
most likely to reawaken to erupt, "...perhaps before the end of this
century." Their prediction came true when Mount St. Helens rumbled back to
life in March of 1980. Intermittent explosions of ash and steam and periodic
formation of short-lived lava domes continued throughout the decade. Analysis of
the volcano's past behavior indicates that this kind of eruptive activity may
continue for years or decades, but another catastrophic eruption like that of
May 18, 1980, is unlikely to occur soon.
On 18 May 1982, the U.S. Geological Survey (USGS)
formally dedicated the David A. Johnston Cascades Volcano Observatory (CVO) in
Vancouver, Washington, in memory of the Survey volcanologist killed two years
earlier. This facility, which is a sister observatory to the Hawaiian Volcano
Observatory, facilitates the increased monitoring and research on not only
Mount St. Helens but also the other volcanoes of the Cascade Range of the
Pacific Northwest. More recently, in cooperation with the State of Alaska, the
USGS established the Alaska Volcano Observatory in March 1988. The work being
done at these volcano observatories provides important comparisons and contrasts
between the behavior of the generally non-explosive Hawaiian shield volcanoes
and that of the generally explosive composite volcanoes of the Cascade and
Alaskan Peninsula-Aleutian chains.
What
does "volcano monitoring" actually involve?
Basically, it is the
keeping of a detailed "diary" of the visible and invisible changes in a volcano and its surroundings. Between eruptions, visible changes
of importance to the scientists would include marked increase or decrease of
steaming from known vents; emergence of new steaming areas; development of new
ground cracks or widening of old ones; unusual or inexplicable withering of
plant life; changes in the color of mineral deposits encrusting fumaroles; and
any other directly observable, and often measurable, feature that might reflect
a change in the state of the volcano. Of course, the "diary" keeping
during eruptive activity presents additional tasks. Wherever and whenever they
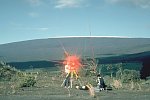
can do so safely, scientists document, in words and on film, the course of the
eruption in detail; make temperature measurements of lava and gas; collect the
eruptive products and gases for subsequent laboratory analysis; measure the
heights of lava fountains or ash plumes; gage the flow rate of ash ejection or
lava flows; and carry out other necessary observations and measurements to fully
document and characterize the eruption. For each eruption, such documentation
and data collection and analysis provide another building block in constructing
a model of the characteristic behavior of a given volcano or type of eruption. Volcano
monitoring also involves the recording and analysis of volcanic phenomena not
visible to the human eye, but measurable by precise and sophisticated
instruments. These phenomena include ground movements, earthquakes (particularly
those too small to be felt by people), variations in gas compositions, and
deviations in local electrical and magnetic fields that respond to pressure and
stresses caused by the subterranean magma movements.
Some
common methods used to study invisible, volcano-related phenomena are based on:
1.
Measurement of changes in the shape of the volcano-- volcanoes gradually swell
or "inflate" in building up to an eruption because of the influx of
magma into the volcano's reservoir or "plumbing system"; with the
onset of eruption, pressure is immediately relieved and the volcano rapidly
shrinks or "deflates." A wide variety of instruments, including
precise spirit-levels, electronic "tiltmeters, and electronic-laser beam
instruments, can measure changes in the slope or "tilt" of the volcano
or in vertical and horizontal distances with a precision of only a few parts in
a million.
2. Precise determination of the location and magnitude of earthquakes by a
well-designed seismic network--as the volcano inflates by the rise of magma, the
enclosing rocks are deformed to the breaking point to accommodate magma
movement. When the rock ultimately fails to permit continued magma ascent,
earthquakes result. By carefully mapping out the variations with time in the
locations and depths of earthquake foci, scientists in effect can track the
subsurface movement of magma, horizontally and vertically.
3. Measurement of changes in volcanic-gas composition and in magnetic field--the
rise of magma high into the volcanic edifice may allow some of the associated
gases to escape along fractures, thereby causing the composition of the gases
(measured at the surface) to differ from that usually measured when the volcano
is quiescent and the magma is too deep to allow gas to escape. Changes in the
Earth's magnetic field have been noted preceding and accompanying some
eruptions, and such changes are believed to reflect temperature effects and/or
the content of magnetic minerals in the magma.
 Recording
historic eruptions and modern volcano-monitoring in themselves are insufficient
to fully determine the characteristic behavior of a volcano, because a time
record of such information, though perhaps long in human terms, is much too
short in geologic terms to permit reliable predictions of possible future
behavior. A comprehensive investigation of any volcano must also include the
careful, systematic mapping of the nature, volume, and distribution of the
products of prehistoric eruptions, as well as the determination of their ages by
modern isotopic and other dating methods. Research on the volcano's geologic
past extends the data base for refined estimates of the recurrence intervals of
active versus dormant periods in the history of the volcano. With such
information in hand, scientists can construct so-called "volcanic
hazards" maps that delineate the zones of greatest risk around the volcano
and that designate which zones are particularly susceptible to certain types of
volcanic hazards (lava flows, ash fall, toxic gases, mudflows and associated
flooding, etc.).
Recording
historic eruptions and modern volcano-monitoring in themselves are insufficient
to fully determine the characteristic behavior of a volcano, because a time
record of such information, though perhaps long in human terms, is much too
short in geologic terms to permit reliable predictions of possible future
behavior. A comprehensive investigation of any volcano must also include the
careful, systematic mapping of the nature, volume, and distribution of the
products of prehistoric eruptions, as well as the determination of their ages by
modern isotopic and other dating methods. Research on the volcano's geologic
past extends the data base for refined estimates of the recurrence intervals of
active versus dormant periods in the history of the volcano. With such
information in hand, scientists can construct so-called "volcanic
hazards" maps that delineate the zones of greatest risk around the volcano
and that designate which zones are particularly susceptible to certain types of
volcanic hazards (lava flows, ash fall, toxic gases, mudflows and associated
flooding, etc.).
Scientist,
wearing asbestos gloves and gas mask, samples volcanic gases from active
vent.
Volcano-Monitoring
Techniques
Illustration by B. Myers
Monitoring Strategy
Volcano monitoring methods are designed to detect and
measure changes in the state of a volcano caused by magma movement beneath the
volcano. Rising magma typically will trigger swarms of earthquakes and other
types of seismic events, cause swelling or subsidence of a volcano's summit
or flanks, and lead to the release of volcanic gases from the ground and
vents. By monitoring these phenomena, scientists are sometimes able to
anticipate an eruption days to weeks ahead of time and to detect remotely the
occurrence of certain volcanic events like explosive eruptions and lahars. Scientists
work as close as possible to the active vent(s) of a
volcano so that they can observe and measure changes that often occur when magma
rises toward the surface. When a volcano shows signs of unrest or is erupting, scientists
often make several visits a week to conduct various surveys and to install
and maintain instruments that enable us to track its activity 24 hours a day. If
an eruption causes significant changes to nearby watersheds, for example by
killing vegetation and depositing fresh volcanic debris over broad areas, scientists
work extensively in river valleys to keep track of erosion and sedimentation
downstream from the volcano. Scientists also collaborate with scientists specializing in
satellite remote-sensing techniques to provide real-time warning of hazardous
events (for example, eruption clouds).
Working directly on the rugged slopes of a volcano to
measure and observe changes in its activity and to install and maintain a
network of volcano-monitoring instruments are crucial for determining when a
volcano might erupt. When a volcano begins to show new or unusual signs of
activity, our monitoring data help scientists answer four critical questions for
reducing the risk from volcanoes:
- Does the
current unrest involve the movement of magma?
- If yes,
when is an eruption most likely to occur, if at all?
- During an
eruption, what real-time warnings are needed to prevent loss of life and
property damage?
- When is
the eruption really over?
The monitoring data
scientists collect also helps address a
variety of other important questions, including:
- What is
the nature of a volcano's magma-reservoir system?
- What is
the cause of specific volcano-seismic events?
- How do
volcanic ash clouds disperse downwind of an erupting volcano?
- How
susceptible to massive slope failures (landslides) are volcanoes?
Hydrologic
Monitoring of Volcanoes
When water combines with loose rocks and sediment
in river valleys to form a flood or lahar,
large areas downstream from a volcano can be buried with water and
sediment several meters thick. Scientists monitoring an active volcano
face the critical challenge of detecting a potentially dangerous lahar
in real time so that a warning can be issued by public officials to
people downstream.
An even more difficult and less obvious challenge
for scientists, however, comes in the weeks and years after an eruption
that significantly alters a volcano's watersheds--monitoring the
long-term threat of sediment transport and increased flooding.
For example, annual sediment yields following the explosive 1980
eruption of Mount St. Helens were as much as 500 times greater than
typical background level. After 20 years, the average annual
suspended-sediment yield in the Toutle River downstream from the 1980
landslide deposit was still 100 times above typical background level.
Why is this a potential problem? Such high
sediment yields often cause river channels leading away from an active
volcano to gradually fill with new, loose sediment. As such channels
partially fill with sediment, their capacity to convey water within
their banks is reduced, which commonly results in more frequent flooding
during periods of intense rainfall. The experience at Mount St. Helens,
and more recently with 1991 eruption of Mount Pinatubo in the
Philippines, shows that effective mitigation measures must remain
functional for decades following a major volcanic disturbance in order
to reduce the likelihood of flooding.
Methods of hydrologic monitoring
Detecting lahars in real
time--
Detection of lahars and other
debris flows close to their sources provides an opportunity for timely
warnings to people in downstream areas if adequate communication systems
exist. USGS scientists have developed an inexpensive, durable, portable,
and easily installed system to detect and continuously monitor the arrival
and passage of debris flows and floods in river valleys draining active
volcanoes. This system has the potential to save many lives from one of
the most dangerous hazards posed to people who choose to live along rivers
leading away from an active volcano.
Measuring
sediment on the move--
Keeping track of how much sediment
is carried downstream from volcanoes and deposited in river channels near
farmland and communities is a major goal of a hydrologic monitoring
effort. Most sediment is transported from volcanically-disturbed
watersheds during periods of heavy rain. Scientists use stream-gaging
instruments to measure the volumes of both water and sediment carried by
rivers.
Surveying river
channels--
New volcanic deposits consisting
of loose, fragmented rocks are no match for the erosive power of running
water, which can quickly carve wide and deep channels. In order to keep
track of the erosion and corresponding sedimentation downstream,
scientists make regular surveys in the river channels.
Monitoring
Volcano Ground Deformation
The surface of a volcano often changes shape when
magma moves beneath it or rises into its cone. Hundreds of shallow
cracks or deep faults tens to hundreds of meters long may develop in
hours or days. The ground can change shape by rising up, subsiding,
tilting, or forming bulges that are clearly visible to people familiar
with the volcano.
Scientists
use a variety of methods to monitor a volcano's changing shape or deformation.
Some methods are as simple as using a steel tape to measure a widening
ground crack. Most volcano deformation, however, can only be detected
and measured with precise surveying techniques, sensitive instruments
placed on the ground or in deep holes, and satellite-based technology.
Whatever the method, our goal is the same: determine the changes
occurring at a volcano that help us provide eruption warnings and to
understand how volcanoes work.
Methods
 Electronic
Distance Measurements-- Measuring the distance between
benchmarks placed on a volcano tens to thousands of meters apart with
electronic distance meters.
Electronic
Distance Measurements-- Measuring the distance between
benchmarks placed on a volcano tens to thousands of meters apart with
electronic distance meters.
EDM at Kilauea
Volcano
 Tiltmeters-- Measuring tiny changes in the
slope angle or "tilt" of the ground with tiltmeters is one of
the oldest methods for monitoring volcano deformation.
Tiltmeters-- Measuring tiny changes in the
slope angle or "tilt" of the ground with tiltmeters is one of
the oldest methods for monitoring volcano deformation.
Installing tiltmeter
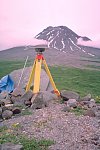 Global
Positioning System-- The Global Positioning System
(GPS) can pinpoint horizontal and vertical movement of the ground in real
time and during surveys.
Global
Positioning System-- The Global Positioning System
(GPS) can pinpoint horizontal and vertical movement of the ground in real
time and during surveys.
Augustine Volcano
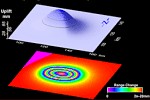 Satellite
Radar Inferometry-- Comparison of radar-generated
images from satellites recorded months to years apart can reveal
deformation patterns over a broad area with remarkable clarity.
Satellite
Radar Inferometry-- Comparison of radar-generated
images from satellites recorded months to years apart can reveal
deformation patterns over a broad area with remarkable clarity.
Interferogram
showing uplift
Monitoring
Volcano Seismicity
Earthquake activity beneath a volcano almost
always increases before an eruption because magma and volcanic gas must
first force their way up through shallow underground fractures and
passageways. When magma and volcanic gases or fluids move, they will
either cause rocks to break or cracks to vibrate. When rocks break
high-frequency earthquakes are triggered. However, when cracks vibrate
either low-frequency earthquakes or a continuous shaking called volcanic
tremor is triggered.
Most volcanic-related earthquakes are less than a
magnitude 2 or 3 and occur less than 10 km beneath a volcano. The
earthquakes tend to occur in swarms consisting of dozens to hundreds of
events. During such periods of heightened earthquake activity,
scientists work around the clock to detect subtle and significant
variations in the type and intensity of seismic activity and to
determine when an eruption is occurring, especially when a volcano
cannot be directly observed.
Methods
A seismometer
is an instrument that measures ground vibrations caused by a variety of
processes, primarily earthquakes. To keep track of a volcano's changing
earthquake activity, scientists typically must install between 4 and 8
seismometers within about 20 km of its vent, with several located on the volcano
itself. This is especially important for detecting earthquakes smaller than
magnitude 1 or 2; sometimes, these tiny earthquakes represent the only
indication that a volcano is becoming restless.
If
a seismometer is located more than 50 km away, these tiny earthquakes could go
undetected.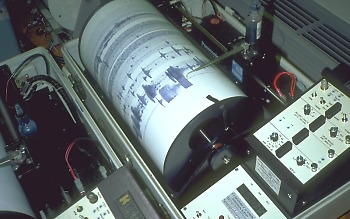 Dramatic improvements in computer
technology and increased scientific experience with volcano seismicity
from around the world have improved our ability to provide eruption
warnings and to characterize eruptions in progress. Computers have enabled
us to locate earthquakes beneath a volcano faster and with greater
accuracy than was possible just 5 years ago, and now scientists can determine in
real time the changing character of a volcano's earthquake activity.
They've also helped us to "map" subsurface structures like fault
zones and magma reservoirs. Even so, the traditional paper or
"analog" records generated by seismographs are still crucial to
us for interpreting the seismic activity beneath a volcano.
Dramatic improvements in computer
technology and increased scientific experience with volcano seismicity
from around the world have improved our ability to provide eruption
warnings and to characterize eruptions in progress. Computers have enabled
us to locate earthquakes beneath a volcano faster and with greater
accuracy than was possible just 5 years ago, and now scientists can determine in
real time the changing character of a volcano's earthquake activity.
They've also helped us to "map" subsurface structures like fault
zones and magma reservoirs. Even so, the traditional paper or
"analog" records generated by seismographs are still crucial to
us for interpreting the seismic activity beneath a volcano.
Seismographs
record seismic signatures, Mount Pinatubo, Philippines
Monitoring
Volcanic Gases
Scientists have long recognized that gases
dissolved in magma provide the driving force of volcanic eruptions, but
only recently have new techniques permitted routine measurement of
different types of volcanic gases released into the atmosphere.
Sulfurous volcanic gas and visible steam are usually the first things
people notice when they visit an active volcano. A number of other gases
also escape sight unseen into the atmosphere through hot fumaroles,
active vents, and porous ground surfaces. The gases escape as magma
rises toward the surface, when it erupts, and even as it cools and
crystallizes below ground. A primary objective in gas monitoring is to
determine changes in the release of certain gases from a volcano,
chiefly carbon dioxide and sulfur dioxide. Such changes can be used with
other monitoring information to provide eruption warnings and to improve
our understanding of how volcanoes work. In recent years, scientists have
directed increased attention toward volcanic gas emissions because of
the newly appreciated hazards they sometimes pose and their effects on
the Earth's atmosphere and climate.
Gases released by most volcanoes are difficult to sample
and measure on a regular basis, especially when a volcano becomes restless.
Direct sampling of gas requires that scientists visit a hot fumarole or an
active vent, usually high on a volcano's flank or within its summit crater. At
some volcanoes, gases discharge directly into crater lakes. The remote location
of these sampling sites, intense and often hazardous fumes, frequent bad
weather, and the potential for sudden eruptions can make regular gas sampling
sometimes impossible and dangerous. Measuring gases remotely is possible but requires ideal
weather and the availability of suitable aircraft or a network of roads around a
volcano. Consistent and favorable wind conditions are needed to carry gases from
vents and fissures to where they can be measured. In some cases, automated
on-site gas monitoring is feasible. Under corrosive conditions, only a few
sensors are available, however, for continuously recording the concentrations of
specific gases. Scientists face yet another challenge--acid gases, like SO2,
easily dissolve in water. Thus, volcanoes with abundant surface or subsurface
water can prevent scientists from measuring the emission of acid gases as magma
rises toward the surface and even after explosive eruptions. Because CO2
is is less likely to be masked by the presence of water, measuring it when a
volcano first becomes restless and between eruptions may be important for
determining whether significant magma degassing is occurring.
Methods of studying volcanic gases
Measuring gas-emission rates in volcanic plumes--
The rate at which a volcano
releases gases into the atmosphere (usually reported in metric tonnes per
day) is related to the volume of magma within its magma-reservoir system
and its hydrothermal system.  By measuring changes in the emission rate of
certain key gases, especially sulfur dioxide and carbon dioxide,
scientists can infer changes that may be occurring in a volcano's magma
reservoir and hydrothermal system.
The emission rates of sulfur dioxide
and carbon dioxide are measured using airborne or ground-based techniques.
During large explosive eruptions, sulfur dioxide gas injected high into
the atmosphere is measured by an instrument aboard a satellite.
By measuring changes in the emission rate of
certain key gases, especially sulfur dioxide and carbon dioxide,
scientists can infer changes that may be occurring in a volcano's magma
reservoir and hydrothermal system.
The emission rates of sulfur dioxide
and carbon dioxide are measured using airborne or ground-based techniques.
During large explosive eruptions, sulfur dioxide gas injected high into
the atmosphere is measured by an instrument aboard a satellite.
Mount St. Helens
Direct gas sampling with laboratory analysis--
Direct sampling of gases escaping
from fumaroles is currently the only way to fully characterize the
composition of gases discharging from volcanoes and to collect data
needed to determine the origin of specific gases. Unfortunately, direct
gas sampling does not provide information about the emission rates of
different gases. 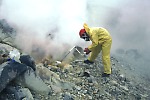 The most common method for sampling volcanic gases is to
collect them directly from fumaroles in solution-filled bottles, and then
to analyze the mixtures in the laboratory. In this photograph, gases are
drawn through a metal tube inserted into a fumarole at Mageik Volcano in
Alaska; the sample was later analyzed at a USGS laboratory in Menlo Park,
California.
The most common method for sampling volcanic gases is to
collect them directly from fumaroles in solution-filled bottles, and then
to analyze the mixtures in the laboratory. In this photograph, gases are
drawn through a metal tube inserted into a fumarole at Mageik Volcano in
Alaska; the sample was later analyzed at a USGS laboratory in Menlo Park,
California.
Mageik
Volcano, Alaska
Continuous
on-site gas monitoring-- ontinuous automated gas
measurements can be made on a volcano directly in fumaroles, in the air
near active fumaroles, and in the soil. At each gas measurement site, one
or more chemical sensors measure the concentration of a specific volcanic
gas, such as sulfur dioxide or carbon dioxide, and these data are
transmitted by radio to a volcano observatory. These sensors can provide a
real-time record of changes in gas concentration that may occur on a time
scale as short as a few minutes. This site is located on the rim of
Halemaumau crater in the summit caldera of Kilauea Volcano, Hawaii.
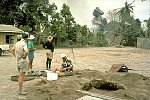
Soil-efflux measurements--
Soil-efflux measurements can be
made in areas where volcanic gases, typically carbon dioxide, rise from
depth and discharge into the upper soil layers near the surface. Dozens of
measurements are needed to map areas of high gas concentration. In this
photograph, scientists are measuring the concentration of carbon dioxide
gas in the soil at a site near Horseshoe Lake at the base of Mammoth
Mountain volcano in California.
Remote Sensing
for Monitoring Volcanoes
 This composite satellite image shows the movement
of an eruption cloud from Mount Spurr Volcano in Alaska (upper left).
The cloud of volcanic ash and gas was erupted at about midnight local
Alaska time on September 16, 1992, and was carried by strong winds
eastward across Canada and the United States. This eruption cloud is
noteworthy because it traveled as a coherent mass for 5 days after the
eruption and disrupted commercial air traffic in Canada and the United
States. Increasingly, satellites are being used by scientists around the
world to track eruption clouds in near real time, especially from
Alaskan volcanoes. Alaska daylight time equals GMT (Greenwich Mean Time)
minus 8 hours.
This composite satellite image shows the movement
of an eruption cloud from Mount Spurr Volcano in Alaska (upper left).
The cloud of volcanic ash and gas was erupted at about midnight local
Alaska time on September 16, 1992, and was carried by strong winds
eastward across Canada and the United States. This eruption cloud is
noteworthy because it traveled as a coherent mass for 5 days after the
eruption and disrupted commercial air traffic in Canada and the United
States. Increasingly, satellites are being used by scientists around the
world to track eruption clouds in near real time, especially from
Alaskan volcanoes. Alaska daylight time equals GMT (Greenwich Mean Time)
minus 8 hours.
The launch of new satellites each year and new
developments in remote-sensing techniques have expanded the capability of
scientists worldwide to monitor volcanoes using satellites. For the purpose of
studying volcanoes, remote sensing is the detection by a satellite's sensors of
electromagnetic energy that is absorbed, reflected, radiated, or scattered from
the surface of a volcano or from its erupted material in an eruption cloud. A
variety of sensors are used to measure wavelengths of energy that are beyond the
range of human vision; for example ultra- violet, infrared, and microwave.
The application of remote-sensing techniques for volcano
monitoring is far from routine at volcano observatories and the techniques are
not likely to replace conventional ground-based monitoring methods. For
well-monitored volcanoes, satellite observations are complementary in nature and
they can be extremely important for tracking eruption clouds. For many of the
world's volcanoes that are either extremely remote or not monitored well,
satellite observations of volcanic activity may be all that is available because
of the extensive coverage they provide.
Applications of Satellite Monitoring
- Tracking
Eruption Clouds
- Measuring
Sulfur Dioxide Gas in Eruption Clouds
- Detecting
Hot Features on Volcanoes
Studying Past Eruptive
History
Scientists look at
volcanic deposits around the volcano to determine their age, type (lava flows,
mudflows, ash flows), size, and distance from the volcano. This data will help
to determine if the volcano is active. Scientists look for patterns of activity. Does
the volcano erupt or produce mudflows at regular intervals? Does it have a
consistent sequence of events, such as a number of effusive eruptions followed
by an explosive one or several small eruptions followed by a large one?
Combining the sizes and ages of different types of deposits will help us
evaluate the risk
of a particular volcanic hazard at a particular volcano.
Past history can only help us in
a limited way, however, because experience with many volcanoes has shown that no
two eruptions of a single volcano are exactly alike and no two volcanoes produce
exactly the same sequence of eruptions. Since each volcano is unique,
predictions concerning the next eruption of any given volcano always have an
element of uncertainty. This is why any volcano showing current signs of
activity needs to be monitored in "real time."
Preparing for
Volcanic Emergencies
Communication is key to saving lives
Recent advances in volcano monitoring, new and refined
volcano-hazard assessments, and better warning schemes have significantly
improved our capability to warn of volcano hazards and impending eruptions. Our
volcano information and warnings, however, no matter how timely or precise, will
reduce volcanic risk only if they are communicated effectively to a wide
audience, especially to people who live and work in potentially hazardous areas
and to emergency-management specialists.
Increasing public awareness of volcano hazards
In addition to carrying out specialized studies on
volcanoes and hazards posed by them, scientists participate in a wide variety of
projects and activities intended to increase awareness of volcano hazards and
minimize future consequences of volcano activity in the United States:
- participate
in volcano-emergency planning workshops and emergency-response exercises
- convene
international, regional, and local workshops focused on volcano-hazard
issues
- prepare
educational materials with partners, including exhibits, fact sheets,
booklets, video programs, and maps
- collaborate
with emergency-management specialists to develop effective warning schemes
- meet
with community leaders and residents wanting information about potentially
dangerous volcanoes in their area
- work
with the news media and media producers
- lead
educational field trips to active and potentially dangerous volcanoes for
the public, officials, local residents, educators, and students
- help
educators and students with classroom presentations, teacher workshops,
field trips, and activities
In developing and delivering easily understandably hazard
information that others may act on, scientists do not dictate or advocate specific
mitigation measures, because such measures must be decided in view of social,
political, and economic considerations that are beyond USGS responsibility and
expertise. Rather, scientists try to provide the best possible scientific information
about volcanoes that will help people to choose and manage the risks associated
with active and potentially active volcanoes.
Eruption Warning
and Real-Time Notifications
The best warning of a volcanic eruption is one
that specifies when and where an eruption is most likely to occur and
what type and size eruption should be expected. Such accurate
predictions are sometimes possible but still rare in volcanology. The
most accurate warnings are those in which scientists indicate an
eruption is probably only hours to days away based on significant
changes in a volcano's earthquake activity, ground deformation, and gas
emissions. Experience from around the world has shown that most
eruptions are preceded by such changes over a period of days to weeks. A volcano may begin to show signs of unrest
several months to a few years before an eruption. In these cases,
however, a warning that specifies when it might erupt months to years
ahead of time are extremely rare.
Strategy of Volcano Warnings
The strategy that
scientists use to provide volcano warnings in
the United States involves a series of alert levels that correspond generally to
increasing levels of volcanic activity. As a volcano becomes increasingly active
or as our monitoring data suggest that a given level of unrest is likely to lead
to a significant eruption, scientists declare a corresponding higher alert level. This
alert level ranking thus offers the public and civil authorities a framework
they can use to gauge and coordinate their response to a developing volcano
emergency. Scientists currently use different alert levels (also referred to
as status levels, condition levels, or color code) for providing volcano
warnings and emergency information regarding volcanic unrest and eruptions.
These levels are different for Long Valley caldera in California and for
volcanoes in Alaska, the Cascade Range in the Pacific Northwest, and Hawaii for
several reasons:
- Volcanoes
exhibit different patterns of unrest in the weeks to hours before they
erupt, which means that uniform and strict criteria cannot be applied to all
episodes of unrest
- Communities,
people, and economic activity are threatened by US volcanoes with different
types of volcano hazards so that a warning scheme must address specific
hazards from a volcano
- US
volcanoes are not monitored with the same degree of intensity, depending on
degree of historical unrest and eruptions and potential future risk
Uplift
or Inflation As
a mass of new lava rises to the surface, it pushes the old rock aside and upward
making a bulge or uplift on the surface. The process is often called inflation,
because the expansion of a volcano due to the lava pushing up inside is similar
to inflating a balloon by blowing new air into it. The inflation of a volcano is
measured in several ways: by tilt meters that measure the angle of the ground
surface, by laser ranging using mirrors placed on the mountain, and by precision
surveys using aerial photographs.
Measurement of the volume of a
bulge is very important because it provides an indication of how large the later
eruption will be, since the volume of the bulge on the surface is roughly equal
to the volume of the new magma underground. For example, about one square mile
of the north side of Mount St. Helens bulged outward about 450 feet
(approximately one-tenth of a mile) before the May 18 eruption. Thus the volume
of the bulge was about one square mile times about a tenth of a mile, or about a
tenth of a cubic mile. By comparison, the volume of new lava expelled during the
eruption was later estimated to be a few tenths of a cubic mile.
Case
study: Pilot
Project Mount Rainier Volcano Lahar Warning System (1998)
A two-year cooperative pilot project
was under
way to develop, deploy, and begin operation of an automated system to
detect the occurrence of a lahar in the Puyallup River valley. The U.S.
Geological Survey Volcano Hazards Program and the Pierce County,
Washington, Department of Emergency Management are full partners in the
pilot project. The Puyallup River drains the west flank of Mount
Rainier, and the densely populated Puyallup valley extends about 70 km
diagonally across Pierce County from Mount Rainier to the Port of Tacoma
on Puget Sound. Upon detection of a lahar in the valley, the system is
intended to issue an automatic notice to County emergency-management
officials that would trigger immediate, preplanned emergency-response
actions.
What is the lahar hazard at Mount Rainier?
Careful study of the deposits in the large valleys that
drain Mount Rainier shows that, over the past 10,000 years, Mount Rainier has
been the source of numerous lahars (volcanic debris flows) that buried now
densely populated areas as far as 100 km from the volcano. Lahars are flowing
mixtures of water and sediment that contain such a high concentration of rock
debris that they look and behave like flowing wet concrete. They are capable of
destroying buildings, bridges, and other man-made structures by battering,
dislodgement, and burial.
Prehistoric lahars originated on the steep flanks of the
volcano and were channeled into the big valleys that carry water and sediment
westward to Puget Sound or the Columbia River. Evidence from their deposits
combined with observations of modern debris flows suggest that they traveled at
speeds as fast as 70-80 km/hr at depths of 30 m or more in the confined parts of
the valleys but slowed and thinned in the more distant, wider parts. During the
past few thousand years, lahars that spanned valley floors well into the now
densely populated Puget lowland have recurred, on average, at least every 500 to
1,000 years. There is every reason to expect that future lahars from Mount
Rainier will be similar in behavior and frequency of occurrence to past lahars.
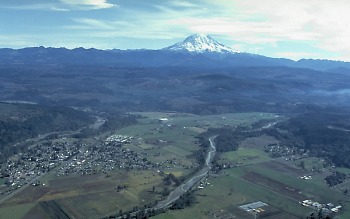 Aerial view of Puyallup River
valley and the growing community of Orting; Carbon River on left and
Puyallup River on right. The most recent large lahar to rush down this
valley occurred about 500 years ago when part of Mount Rainier's west
flank collapsed. The resulting lahar swept through the Puyallup valley,
which contained an old-growth forest, and eventually reached Puget Sound.
The lahar knocked down trees as large as 2-3 m in diameter and encased the
logs as well as the lower parts of still-standing trees in muddy rock
debris about 5 m thick. Some trees and stumps in the lahar deposit were
unearthed during recent construction of new homes on the valley floor.
This photograph is
by S.R. Brantley on September 29, 1992
Aerial view of Puyallup River
valley and the growing community of Orting; Carbon River on left and
Puyallup River on right. The most recent large lahar to rush down this
valley occurred about 500 years ago when part of Mount Rainier's west
flank collapsed. The resulting lahar swept through the Puyallup valley,
which contained an old-growth forest, and eventually reached Puget Sound.
The lahar knocked down trees as large as 2-3 m in diameter and encased the
logs as well as the lower parts of still-standing trees in muddy rock
debris about 5 m thick. Some trees and stumps in the lahar deposit were
unearthed during recent construction of new homes on the valley floor.
This photograph is
by S.R. Brantley on September 29, 1992
Why is an automated lahar-detection system needed?
Geologic evidence indicates that many of the large
prehistoric lahars from Mount Rainier originated as surges of meltwater
initiated by rapid melting of snow and ice during eruptions. The meltwater
torrents transformed to lahars by incorporation of loose sediment from the
volcano flanks. Such a lahar, initiated by a small eruption in 1985 at a
Colombian volcano, Nevado del Ruiz, took more than 20,000 lives in Armero, a
valley-floor community located about 75 km from the volcano's summit. The lahar
took about 2.5 hours to reach Armero. People who perished in Armero and other towns
around the volcano could easily have been spared if only they had known
that the lahar was coming and that safety was within an easy walk only a
few hundred meters away. Buildings in the middle of Armero were
completely swept away by the lahar.
Mount Rainier is carefully monitored for signs of volcanic
reawakening, and an eruption that could produce a catastrophic lahar initiated
by vigorous release of meltwater is expected to follow days, weeks, or even
months of readily detected symptoms of volcanic unrest. Thus, it is likely that
there will be opportunity for citizens and communities to prepare for an
impending eruption.
However, deposits of some of the large prehistoric lahars
from Mount Rainier are rich in clay, implying that they contain abundant
hydrothermally altered debris from within the volcano. Therefore, they are
inferred to have originated as huge avalanches of water-saturated, clay-rich
debris from massive gravity-driven failures of the volcano's flanks. Absence of
geologic evidence substantiating coincidence of some of these large, clay-rich,
prehistoric lahars with eruptions raises concern that some may have occurred
with no attendant eruptive activity. They may have been triggered by intrusion
of magma into the edifice, which would show symptoms like those observed before
eruptions. On the other hand, they may have been triggered by earthquakes or
hydrothermal-system explosions, or a volcano flank may simply have collapsed
when it became sufficiently destabilized by progressing hydrothermal alteration.
Such events could generate a massive lahar with no recognized precursory
warning. A reliable lahar-warning system designed to detect such sudden
events can provide notification to people downstream that a lahar is underway.
Inasmuch as lahars seek valley bottoms, people can quickly
climb or drive to safety in many cases by simply evacuating the floor of a
well-defined valley before the lahar arrives; they need go no farther than high
ground adjacent to the valley. A critical issue is to know when
evacuation is necessary. Travel time for a large lahar from Mount Rainier may be
an hour or less to Orting, the city closest to Mount Rainier in the Puyallup
valley, and possibly as little as 30 minutes may be available from detection of
a large lahar to its arrival. Successful evacuation there will depend on
detection of an approaching lahar, clear warning, public understanding of the
hazard, and practiced response by citizens. Decreased lahar velocity as the
valleys broaden downstream gives more time--about an additional hour--for
response in the larger urban areas of Puyallup and Sumner, which are closer to
Puget Sound.
It is critical that the lahar-detection system be
completely automatic. Except during volcanic unrest when intense
around-the-clock monitoring by a team of volcanologists is underway, the time
from initiation of a lahar to its arrival in a populated valley-floor area is
insufficient for analysis of the data by scientists before notices are issued.
Thus the system must be designed to unfailingly detect a lahar with minimum
opportunity for false alarms.
How does the system work?
Lahars will be detected by networks of five acoustic flow
monitor (AFM) stations that have been placed within tens to hundreds of meters
from the active flood plain in the upper reaches of both the Puyallup and Carbon
River valleys. The network in each valley is located about 25 km upstream from
Orting, which is near the confluence of the two valleys. Each AFM station
consists of a microprocessor-based data logger that measures the amplitude,
frequency, and duration of ground vibrations detected by an exploration-class
geophone. When measurements exceed programmed thresholds, the data are radioed
to the base-station computer.
Illustration by L. Faust
Simplified schematic of an acoustic-flow monitoring station
Two AFM (acoustic-flow monitor)
stations in each valley are located above flood
level but within the expected inundation zone of a significant lahar. Those
stations, then, will serve as "deadman" devices whose destruction by a
major lahar would be noted by the system. The other three stations in each
valley are located above the anticipated lahar-inundation limit with the
expectation that they will monitor ground vibrations and transmit data
throughout passage of a lahar. Data from all stations are transmitted by radio
to duplicate base-station computers located at the Law Enforcement Support
Agency, City of Tacoma and Pierce County Emergency 9-1-1 Center in Tacoma and at
the Washington State Emergency Operations Center at Camp Murray. Software,
currently under development, analyzes the incoming data and triggers an
automatic unequivocal notice when a significant lahar is detected.
The USGS-Pierce County partnership
The USGS Volcano Hazards Program and the Pierce
County Department of Emergency Management entered into their formal
two-year cooperative agreement in early summer 1998. Working closely
together through the first summer, they selected the station sites and
installed the station housings (55-gallon drums), the station hardware
(geophones, radios, antennas), and telemetry repeater stations sufficient
to ensure a high level of redundancy. At that stage, Pierce County largely
managed site preparation and installation of the station housings, while
the USGS took responsibility for procuring and assembling the station
hardware.
During the remainder of the two-year project, the USGS
role would be primarily to test and evaluate the stations for sensitivity and
durability; set sensitivity parameters so as to filter out ground vibrations
from normal floods, wind, or passing log trucks; develop and test the software
that analyzes data from the stations and governs lahar detection and automatic
notification; and train Pierce County personnel to take over full operation of
the system. The Pierce County Department of Emergency Management will be
responsible for preparing to assume full control and operation of the system and
for developing effective emergency-response actions once a lahar is detected. Upon mutual agreement at the end of the pilot project, it
was expected that Pierce County will assume ownership and full control of the
Puyallup valley lahar-detection network.s
Common questions on
volcano monitoring
What are the
signs that a volcano is about to erupt?
Short answer
Several things happen when a volcano is about to erupt, some of the most obvious
are listed here:
- The number and size of
earthquakes increase in and around the volcano.
- The ground deforms or
"bulges" at the eruption site.
- A lot more gas comes out of the
volcano.
Longer answer
There are lots of signs that are examined, depending on how closely monitored
the particular volcano is. Probably the most common type of monitoring is by
seismicity. Even one seismometer can tell if there is an increase of seismic
activity on a usually seismically-quiet volcano. If you have at least 3
seismometers, and they are strategically placed, you can triangulate on
earthquakes to see if they are occurring in a place that indicates perhaps magma
movement. By examining the seismic data over a period of time you may be able to
determine if the earthquakes are migrating towards the surface (suggesting that
magma is also migrating towards the surface since the earthquakes are probably
being generated as magma breaks rocks that are in its way).
Another type of data that is used is the study of ground
deformation. When magma moves up into the shallow plumbing of a volcano, it
takes up space and pushes the surrounding rock outward. This also causes the
surface of the volcano to deform. Some points move upward and any two points
will move farther apart. By using very accurate leveling and distance-measuring
techniques, these surface changes can be measured. Usually the changes are a few
mm over a distance of a few hundred meters, but sometimes they are dramatic. For
example prior to many eruptions at Kilauea, the summit bulges 1-2 meters upward.
In the last few days prior to the big Mt. St. Helens eruption the northern flank
was bulging outward at a few meters per day!
Some people like to monitor volcanoes by constantly
monitoring gases that come out of fumaroles. Most active volcanoes have
fumaroles where volcanic gases escape to the surface. It is relatively easy to
monitor the temperatures of these gases, and an anomalous increase in
temperature might be a sign that magma has moved closer to the surface.
Monitoring the composition of the gases is more difficult to do, and changes in
the composition are way more difficult to interpret. Many times just visual
changes to fumarole areas are indications of impending activity. If the area of
active degassing gets larger, if the plants nearby die suddenly, if the color of
any lakes or ponds nearby changes...Many volcanoes have summit lakes through
which heat and gases rise to the surface and escape. Many of these lakes have
strange colors due to all the dissolved minerals in them, and many of the
colored ones change color, pH, temperature, etc. These too, are signs of change
below but are often difficult to interpret.
A number of people are studying ways in which to use
satellite data to monitor volcanoes. It is possible to obtain thermal images of
volcanic areas, and by comparing images on a monthly or bi-weekly basis,
increases or decreases in temperatures can be detected. Additionally, some new
technologies have allowed for the determination of very accurate topography from
satellite data. This technology may someday allow for the remote monitoring of
surface deformation associated with sub-surface magma movement. This process is
still being developed. It usually takes too long to get satellite data processed
for this technique to be useful in a rapidly-escalating crisis so it would be
used over the long term, in the years to months prior to an eruption rather than
the hours prior.
How often do
volcanoes erupt and is there a predictable pattern?
Well that depends on the volcano. Some volcanoes erupt
very often (and some like Kilauea almost never stop). On the other hand, some
volcanoes are inactive for very long periods of time between eruptions. For
example Mt. St. Helens erupted in the late 1800's and then again in 1980. That
is considered a relatively short rest for volcanoes in the Cascade range.
Pinatubo, however, last erupted about 400 years ago prior to its 1991 eruption.
Lots of people didn't even consider it to be capable of erupting, it had become
so eroded during those 400 years.
The largest eruptions come from volcanoes called rhyolite
calderas, and these huge eruptions (which we haven't really witnessed since 186
AD in New Zealand) may occur at intervals of 10,000 to 30,000 years.
Yellowstone, the largest caldera in the U.S.A. seems to erupt on average every
600,000 years!
Why does volcanic activity often lead to high rates of
erosion and sedimentation?
Explosive eruptions that destroy
vegetation and deposit volcanic rocks and ash over wide areas create
conditions that (1) promote increased rates of surface runoff during
rainstorms; and (2) dramatically increase the availability of loose
debris that can be eroded and transported into river valleys. The
destruction of vegetation combined with deposition of tephra
on hill slopes reduces the amount of water that normally soaks into the
ground or is transpired by plants. The increased overland flow of water
erodes rock debris from hill slopes and carries it into river valleys.
There, sediment can accumulate and can alter the hydraulic
characteristics of the river channel.
The net effect of such changes to watersheds is
that post-eruption stream velocities and peak discharges during
rainstorms are temporarily much higher than during pre-eruption
conditions. Streams typically respond more quickly to a given amount of
rainfall and produce higher flows as rainfall is quickly flushed through
a watersheds.
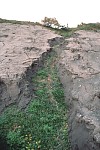 Close view of a gully eroded
into new volcanic deposits within 3 months of the eruption. The
underlying soil layer, topped with pre-eruption vegetation and roots,
prevented running water from eroding into even thicker tephra deposits
erupted by the volcano hundreds of years ago. In many locations,
however, these older deposits were also carried away by surface runoff
during intense rainstorms and transported tens of kilometers downstream.
Close view of a gully eroded
into new volcanic deposits within 3 months of the eruption. The
underlying soil layer, topped with pre-eruption vegetation and roots,
prevented running water from eroding into even thicker tephra deposits
erupted by the volcano hundreds of years ago. In many locations,
however, these older deposits were also carried away by surface runoff
during intense rainstorms and transported tens of kilometers downstream.
