DevELOPMENT OF A TOOL FOR
PROJECT sCHEDULING
by
Alexiei
Dingli
Assigned Practical Task CST399 submitted in partial fulfillment of the
requirements for the degree of
B.Sc.I.T.(Hons)
University of Malta
Academic
Year 1999/2000
Abstract
This documentation is meant to illustrate the steps involved towards developing a graphically oriented tool for planning, control and management of the software engineering development process. It gives a detailed description of the project life cycle, starting from the set of initial goals, the research conducted before initialization and the general approach to solve the problem. The document continues through the main phases of the life cycle i.e. specification, design, implementation and concludes with testing and evaluation. Apart from this, it also provides a guide to the user on the correct usage of the tool. The final achievements of the whole project are grouped in a brief summary towards the end of the main document.
Acknowledgements
Thanks to the supervisor of the project, Dr Ernest Cachia for the helpful comments on the earlier stages of the tool’s development life cycle.
Table of Contents
2.2 Program
Evaluation and Review Technique (PERT)
2.3 Critical Path
Method (CPM)
2.7 Specification
and Design Background
3.2 Level 0 Data
Flow Diagrams
Level 1 Data Flow
Diagram – Decomposing GUI Handler
Level 1 Data Flow
Diagram – PERT Machine
Level 1 Data Flow
Diagram – PERT to Gantt Converter
Level 1 Data Flow
Diagram – PERT to Reuse Histogram Converter
Level 1 Data Flow
Diagram – PERT Analyzer
3.3 Data
Dictionary – Letters A to B
Data Dictionary –
Letters C to F
Data Dictionary –
Letters G to O
Data Dictionary –
Letters P to Q
Data Dictionary –
Letters R to S
3.5 Finite State
Machine to further explain DFD bubble 1.1
Finite State
Machine to further explain DFD bubble 1.2
Finite State Machine
to further explain DFD bubble 1.3
Finite State
Machine to further explain DFD bubble 2.1
Finite State
Machine to further explain DFD bubble 2.2
Finite State
Machine to further explain DFD bubble 2.3
Finite State
Machine to further explain DFD bubble 2.4
Finite State
Machine to further explain DFD bubble 2.5
Finite State
Machine to further explain DFD bubble 3.1
Finite State
Machine to further explain DFD bubble 3.2
Finite State
Machine to further explain DFD bubble 3.3
Finite State
Machine to further explain DFD bubble 4.1
Finite State
Machine to further explain DFD bubble 4.2
Finite State
Machine to further explain DFD bubble 4.3
Finite State
Machine to further explain DFD bubble 5.1
Finite State
Machine to further explain DFD bubble 5.2
- Perform Reachability
and Connectivity Analysis
Finite State
Machine to further explain DFD bubble 5.3
- Perform
Transitive Closure Analysis
Finite State
Machine to further explain DFD bubble 5.4
Explanation of
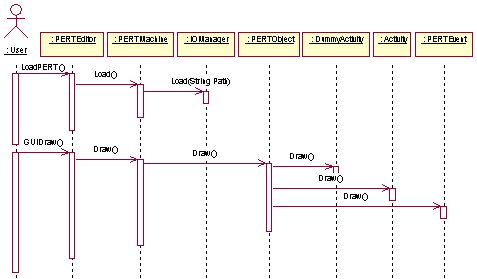
GUIDraw method in PERTEditor
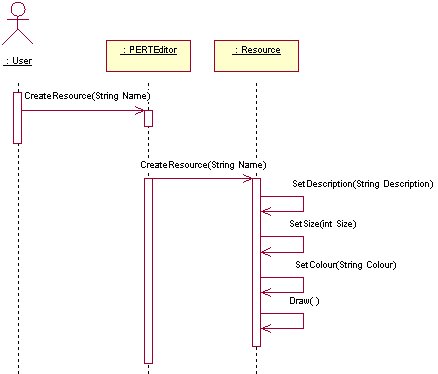
Explanation of
CreateResources method in Resource
Explanation of
Analyze method in AnalysisMachine
Explanation of
Analyze method in PERTtoReuseHistogramConverter
Explanation of
Analyze method in PERTtoGanttConverter
Explanation of
Analyze method in TransitiveClosureAnalysis
PERT to Reuse Histogram Converter
Introduction to
Program Evaluation and Review Technique (PERT)
Conventions for
drawing networks
Introduction to
Critical Path Method (CPM)
Structured
Specification Conventions
1. Introduction
This document is meant to clearly outline the process of producing a plausible solution for the Assigned Practical Task CST399. The tasks undertaken in the project involve, the necessary research to gather background information about the product required, the specification and design of the tool, and the actual implementation together with the actual testing and evaluation. The main aim of the project is to produce an intuitive but powerful tool to help in the planning, control and management of the software engineering development process by using PERT and GANTT charts. The approach in use is based upon the Object Oriented methodology of software development.
The sections in this document are arranged roughly in their original chronological order. Section 2 gives some basic background necessary to understand the rest of the document. Section 3 explains through diagrammatic techniques the Specification of the program and its design. Section 4 concerns the problems, and complexities encountered during the implementation phase together with some explanations of methods used during the actual development. Section 5 relates the evaluation process of the tool together with some critical comments on the weaknesses found. Section 6 suggests future enhancements.
Although new features and improvements can always be added, all the major goals have been reached. Thus the tool offers a simple approach to producing detailed project analysis.
2. Background
2.1 Theoretical Background
Two important and widely used applications of partial order relations are PERT (Program Evaluation and Review Technique) and CPM (Critical Path Method). These techniques came into being in the 1950s to deal with the complexities of scheduling the individual activities needed to complete very large projects, and although they are very similar, their developments were independent. PERT was developed by the U.S. Navy to help organize the construction of the Polaris submarine, and CPM was developed by the E. I. Du Pont de Nemours company for scheduling chemical plant maintenance. Network analysis is a generic term for a family of related techniques developed to aid management to plan and control projects. These techniques show the inter-relationship of the various jobs or tasks which make up the overall project and clearly identify the critical parts of the project. They can provide planning and control information on the time, cost and resource aspects of a project.
Reference [MODE 96]
2.2 Program Evaluation and Review Technique (PERT)
Program evaluation and review technique (PERT) charts depict task, duration, and other project related information. Each chart starts with an initiation node known as Event, from which the initial tasks, originates. If multiple tasks begin at the same time, they are all started from the same event. Each task, also known as Activity is represented by a line which states its duration. The other end of the activity line is terminated by another event which identifies the start of another activity, or the beginning of any slack time, that is, waiting time between tasks.
Each activity
is connected to its successor activity in this manner forming a network of
nodes and connecting lines. The chart is complete when all final activities
come together at the completion node. When slack time exists between the end of
one activity and the start of another, the usual method is to draw a broken or
dotted line between the end of the first task and the start of the next
dependent activity. This is known as a dummy activity.
A PERT chart may have multiple parallel or
interconnecting networks of activities. PERT charts are usually drawn on ruled
paper with the horizontal axis indicating time period divisions in days, weeks,
months, and so on. Another alternative
is to include the actual dates inside the Event. Apart from this, an Event can
contain the number of personnel, resources and any comments. Although it is
possible to draw a PERT chart for an entire project, the usual practice is to
break the plans into smaller, more meaningful parts. This is very helpful if
the chart has to be redrawn for any reason, such as skipped or incorrectly
estimated tasks. Many PERT charts terminate at the major review points, such as
at the end of the analysis. (see Appendix A for further detail)
Reference [MODE 96]
2.3 Critical Path Method (CPM)
Critical Path Method (CPM) charts
are similar to PERT charts and are sometimes known as PERT/CPM. In a CPM chart,
the critical path is indicated. A critical path consists of a set of dependent
activities (each dependent on the preceding one) which together take the
longest time to complete. Critical
Path Analysis is an extremely effective method of analyzing a complex project.
It helps to calculate the minimum length of time in which the project can be
completed, and which activities should be prioritized to complete by that date.
Whenever a job has to
be completed on time, critical path analysis helps the project manager to focus
on the essential activities to which attention and resources should be devoted.
It gives an effective basis for the scheduling and monitoring of progress.
A CPM chart can also define multiple, equally critical paths. The essential concept behind this is that some plan activities are dependent on other activities being completed first. These dependent activities need to be completed in a sequence, with each activity being more-or-less completed before the next activity can begin. Dependent activities are also called 'sequential' activities. Other activities are not dependent on completion of any other tasks, or may be done at any time before or after a particular stage is reached. These are non-dependent or 'parallel' tasks.
Tasks on the critical path should be noted in some way, so that they may be given special attention. One way is to draw critical path tasks with a double line instead of a single line or using another color to differentiate them from normal activities.
The critical path for any given method may shift as the project progresses; this can happen when tasks are completed either behind or ahead of schedule, causing other tasks which may still be on-schedule to fall on the new critical path. (see Appendix B for further detail)
Reference [LUCE 96]
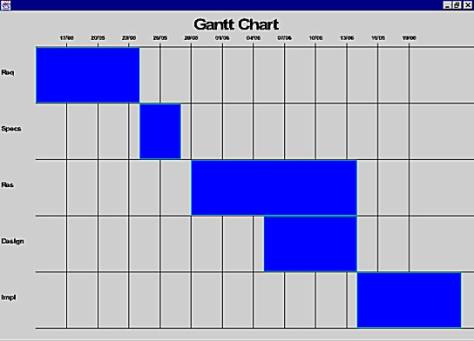
2.4 Gantt chart
A Gantt chart is a matrix which lists on the vertical axis all the tasks to be performed. Each row contains a single task identification which usually consists of the task name. The horizontal axis is headed by columns indicating estimated task duration, followed by one column for each period in the project's duration. Each period may be expressed in hours, days, weeks, months, and other time units. The graphics portion of the Gantt chart consists of a horizontal bar for each task connecting the period start and period ending columns. Each bar is drawn on a separate line. The chart can be developed to plan the whole project.
Reference [MNDT 00]
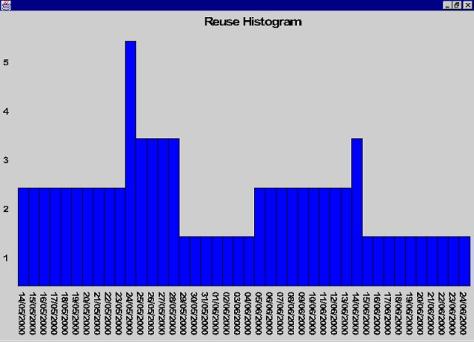
2.5 Reuse Histogram
Reuse has long been touted as a method for improving product quality. By reusing products that have already been tested, delivered, and used elsewhere, we avoid making the same mistakes twice. Developers can take advantage of the efforts of other developers before them. A Reuse Histogram is very useful especially in software projects. It gives to the developer a visual overview of the amount of reuse being plugged into the final product. The higher the amount will surely result in a more reliable product since the part reused is already verified beforehand. The Histogram shows on the vertical axis the amount of components reused. Each row contains a single reusable component. The horizontal axis is headed by columns indicating estimated task duration, followed by one column for each period in the project's duration. Each period may be expressed in hours, days, weeks, months, and other time units. The graphics portion of the histogram consists of a vertical bar for each period.
Reference [PFLE 98]
2.6 TransitiveClosureAnalysis
The Transitive Closure Analysis must perform basically two functions, a check for connectedness and find out the transitive closure of the connected network.
Connectedness
Connectedness is an easy concept to understand on an intuitive level. Roughly speaking, a graph is connected if it is possible to travel from any vertex to any other vertex along a sequence of adjacent edges of the graph. The formal definition of connectedness is stated in terms of walks.
Definition
Let
G be a graph and let v and w be vertices in G. A walk from v to w is a finite
alternating sequence of adjacent vertices and edges of G. Two vertices v and w of G are connected if,
and only if, there is a walk from r to w.
The graph G is connected if, and
only if, given any two vertices v and w in G, there is a walk from v
to w.
Symbolically:
G
is connected ↔ " vertices v,
w Î V(G), $ a walk from u to w.
Transitive Closure
Generally speaking, a relation fails to be transitive because it fails to contain certain ordered pairs. For example, if (1, 3) and (3, 4) are in a relation R, then the pair (1, 4) must be in R if R is to be transitive. To obtain a transitive relation from one that is not transitive, it is necessary to add ordered pairs. Roughly speaking, the relation obtained by adding the least number of ordered pairs to ensure transitivity is called the transitive closure of the relation. In a sense made precise by the formal definition, the transitive closure of a relation is the smallest transitive relation that contains the relation.
Definition
Let
A be a set and R a binary relation on A. The transitive closure of R is
the binary relation Rt on A that
satisfies the following three properties:
1. Rt is transitive;
2.
R Í Rt;
3. If S is any other transitive relation that
contains R, then Rt Í S.
Reference [EPPS 95]
2.7 Specification and Design Background
The software specification and design techniques used are not based on any particular methodology but on a hybrid group of standard techniques. These group of techniques used can be divided into two main groups.
1. The Structured Specification group which makes use of traditional software engineering techniques to produce a complete specification independent of any particular implementation tool or language. These techniques include Data Flow Diagrams, Data Dictionary, Entity Relational Diagrams and Finite State Machines. All these methods are widely used in the good design of a Structured Specification. The tools used to create these specifications are a word processor and a graphics package.
2. The Object Oriented Design group makes use of more recent techniques to produce a design consistent with the specification. The techniques create static and dynamic views of a logical model and a physical model to capture the in-process products of object-oriented analysis and design. Using the notations available, an overall model representing the problem domain and software system are created and refined. The techniques include Prototypes, Use Cases, Class Model, Sequence Diagram, Collaboration Diagram, State Diagram, Component Views and Deployment Views. Each of these model elements possesses model properties that identify and characterize them. The tool used to create these design is Rational Rose 98 which is based upon the industry-standard language Unified Modeling Language (UML). It is used for specifying, visualizing, constructing, and documenting the artifacts of software systems. It simplifies the complex process of software design, making a "blueprint" for construction. This approach was mainly used because the development language chosen was Java, which is a pure Object Oriented Language, which would therefore facilitate the translation from the design to the implementation.
The detailed use of these techniques is beyond the scope of this document, but for further reference, the reader is suggested to check out the references below which I myself found very useful during the development of the product. Also Appendix C contains a short summary of any particular conventions used during Specification.
Structured Specification References [INCE 97] [BEHF 96] [MEIL 96] [SOMM 98] [MCDE 94] [ELMA 94]
Object Oriented Design References [ERIK
98] [BENN 99] [SCHA 97] [INCE 97] [RATI 00] [JEEV 00]
3. Specification and Design
3.1 Specification
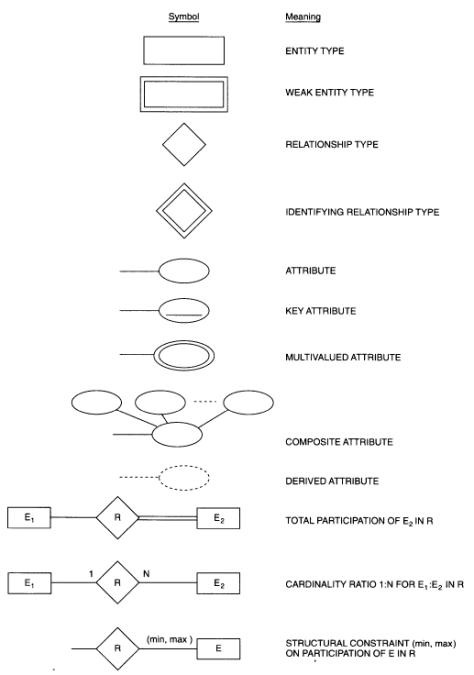
The specification of the program as already discussed in the previous section is constructed using tradition Software Engineering Techniques. In section 3.2, the specification of the system is made using data flow diagrams. I used this kind of model because it clearly shows the flow of data between the different parts of the program and the functional requirements of the program. Section 3.3 makes use of a data dictionary to explain the type of data which was used in the Data Flow Diagram. This servers as both as a reference for later phases and for consistency check between the different Software Engineering phases. Section 3.4 shows an Entity Relational Model. This has the purpose of describing entities, relationships and attributes. Finally Section 3.5 make use of Finite State Machines as primitive specifications to explain some Data Flow Diagrams bubbles.
3.2 Level 0 Data Flow Diagrams
Level 1 Data Flow Diagram – Decomposing GUI Handler
Level 1 Data Flow Diagram – PERT Machine
Level 1 Data Flow Diagram – PERT to Gantt Converter
Level 1 Data Flow Diagram – PERT to Reuse Histogram Converter
Level 1 Data Flow Diagram – PERT Analyzer
3.3 Data Dictionary – Letters A to B
|
Name : |
|
Activity |
|
Aliases : |
|
Activity , Dummy Activity |
|
Where/How Used : |
|
An activity is a link between two events. |
|
Description : |
|
Activity = *A No. of an activity* + *A No. of an activity* |
|
Supplementary
Information : |
|
There is a graphical difference between a Dummy Activity and a non dummy one. This Dummy activity is dotted while the other is in the form of a solid line. Dummy activities are used to keep the network consistent. |
|
Data Structure
Diagram : |
|
|
|
|
|
|
Name : |
|
Analysis Results |
|
Aliases : |
|
Analysis Results |
|
Where/How Used : |
|
This data is the result obtained after analyzing the PERT chart. |
|
Description : |
|
Analysis Results = { Line of Text } n |
|
Supplementary
Information : |
|
|
|
Data Structure
Diagram : |
|
|
|
|
|
|
Data Dictionary – Letters C to F
|
Name : |
|
Commands |
|
Aliases : |
|
User Commands, PERT Commands, Pert Create/Edit Commands, Modification Commands |
|
Where/How Used : |
|
User to instruct the PERT machine and GUI Handler what operations to perform |
|
Description : |
|
Commands = { Alpha-Numeric } n |
|
Supplementary
Information : |
|
Can also take the form of procedure calls where the alphanumeric string represent the name of the procedure. |
|
Data Structure
Diagram : |
|
|
|
|
|
|
Data Dictionary – Letter G
|
Name : |
|
Graphical Representation |
|
Aliases : |
|
Graphical Representation, Filtered Structure, Decomposed Structure |
|
Where/How Used : |
|
A structure which holds only the information necessary to display on screen. |
|
Description : |
|
Graphical Representation = { [ Activity | Dummy Activity ]
} n + [ { Partial Event } n | { Total Event } n ] |
|
Supplementary
Information : |
|
|
|
Data Structure
Diagram : |
|
|
|
|
|
|
Data Dictionary – Letters G to O
|
Name : |
|
Graphical Request |
|
Aliases : |
|
Graphical Request, PERT Graphical Refresh Request, Gantt Graphical Refresh Request, Histogram Graphical Refresh Request |
|
Where/How Used : |
|
A form of command used to ask the different objects to repaint themselves and return the results. |
|
Description : |
|
Graphical Request = { Alpha-Numeric } n |
|
Supplementary
Information : |
|
Can also take the form of procedure calls where the alphanumeric string represent the name of the procedure. |
|
Data Structure
Diagram : |
|
|
|
|
|
|
Name : |
|
Line of Text |
|
Aliases : |
|
Line of Text |
|
Where/How Used : |
|
This data object is simply a list of alpha-numeric characters |
|
Description : |
|
Line of Text = { Alpha-Numeric } n |
|
Supplementary
Information : |
|
|
|
Data Structure
Diagram : |
|
|
|
|
|
|
Data Dictionary – Letter P
|
Name : |
|
Partial Events |
|
Aliases : |
|
Partial Events |
|
Where/How Used : |
|
Partial Events are Events in a PERT chart which show only a part of the data. They are used for analysis and Conversions |
|
Description : |
|
Partial Events = No. + Name + Start-Date + End-Date No. = *Any Integer* Name = *Any String* Start-Date = *Any Date* End-Date = *Any Date greater or equal to Start-Date* |
|
Supplementary
Information : |
|
|
|
Data Structure
Diagram : |
|
|
|
|
|
|
Data Dictionary – Letters P to Q
|
Name : |
|
PERT structure |
|
Aliases : |
|
PERT structure, Partial Pert Structure, Modified PERT structure, Modified Structure, Verifier Structure |
|
Where/How Used : |
|
A structure which holds all the data relevant to a PERT chart |
|
Description : |
|
PERT structure = {[ Activity | Dummy Activity ]} n + { Total Event } n |
|
Supplementary
Information : |
|
|
|
Data Structure
Diagram : |
|
|
|
|
|
|
Data Dictionary – Letters R to S
|
Name : |
|
Reusable Resource List |
|||
|
Aliases : |
|
Reusable Resource List, Reusable Repository |
|||
|
Where/How Used : |
|
Holds a list of Reusable resources. |
|||
|
Description : |
|
Reusable Resource List = { Resource + Usage } n Resource = *Any String with name of resource* Usage = *Any Integer* |
|||
|
Supplementary
Information : |
|
Can be local to an event or global to the whole chart. |
|||
|
Data Structure
Diagram : |
|
|
|||
|
|
|
|
Data Dictionary – Letter T
|
Name : |
|
Total Events |
|||
|
Aliases : |
|
Total Events |
|||
|
Where/How Used : |
|
Total Events are Events in a PERT chart with all the details |
|||
|
Description : |
|
Total Events = Partial Events + No. Of Days + No. Of Personnel + Reusable Resources List + Comment No. Of Days = *Any Integer* No. Of Personnel = *Any Integer* |
|||
|
Supplementary
Information : |
|
|
|||
|
Data Structure
Diagram : |
|
|
|||
|
|
|
|
Data Dictionary – Letter U
|
Name : |
|
User Data |
|
Aliases : |
|
User Data |
|
Where/How Used : |
|
Used in the input screens to set the various properties of the PERT charts |
|
Description : |
|
User Data = [ *Alpha-Numeric string* | *Number*] |
|
Supplementary
Information : |
|
The type of user data depends on where it is needed, but will always take the above form. |
|
Data Structure
Diagram : |
|
|
|
|
|
|
3.4 Entity Relational Diagram
3.5 Finite State Machine to further explain DFD bubble 1.1
- Event Handler
Finite State Machine to further explain DFD bubble 1.2
- Main Display Manager
Finite State Machine to further explain DFD bubble 1.3
- Sub-Display Manager
Finite State Machine to further explain DFD bubble 2.1
- Command Decoder
Finite State Machine to further explain DFD bubble 2.2
- Structure Modifier
Finite State Machine to further explain DFD bubble 2.3
- PERT Rules Verifier
Finite State Machine to further explain DFD bubble 2.4
- Draw PERT Chart
Finite State Machine to further explain DFD bubble 2.5
- Store/Retrieve Structure
Finite State Machine to further explain DFD bubble 3.1
- Filter Structure
Finite State Machine to further explain DFD bubble 3.2
- Parse and Analyze Structure
Finite State Machine to further explain DFD bubble 3.3
- Gantt Chart Constructor
Finite State Machine to further explain DFD bubble 4.1
- Filter Structure
Finite State Machine to further explain DFD bubble 4.2
- Parse and Analyze Structure

Finite State Machine to further explain DFD bubble 4.3
- Reuse Histogram Constructor
Finite State Machine to further explain DFD bubble 5.1
- Filter Structure
Finite State Machine to further explain DFD bubble 5.2
- Perform Reachability and Connectivity Analysis
Finite State Machine to further explain DFD bubble 5.3
- Perform Transitive Closure Analysis
Finite State Machine to further explain DFD bubble 5.4
- Format Results

3.6 Design
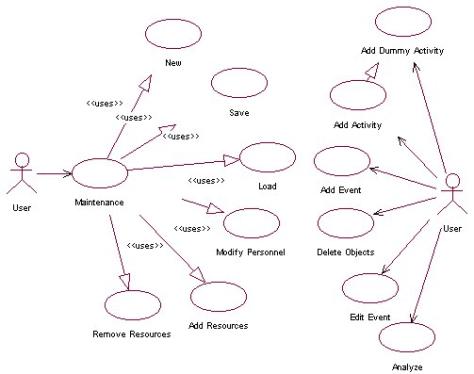
The design of the program as already discussed in the previous section is constructed using Object Oriented Techniques. In Section 3.7, a use case is used to identify a sequence of transactions performed by the system in response to a triggering event initiated by an actor to the system. The use case provides a measurable value to an actor when the actor is performing a certain task. The use case contains all the events that can occur between an actor-use case pair, not necessarily the ones that will occur in any particular scenario. One particular requirement of almost any program is the ease of use. Because of this, one of the most important parts of the program is the Graphical User Interface. In Section 3.8, two prototypes are presented which try to achieve a user-friendly interface. The second prototype is basically a refinement of the first. Section 3.9 makes use of Class diagrams to capture the common structure and common behavior of a set of objects. A class is an abstraction of real-world items. In Section 3.10, for each class that has significant temporal behavior, a State diagram is drawn to describe its behavior. Section 3.11 uses Sequence diagrams to trace the execution of the most important interactions between objects in time, while Section 3.12 uses Collaboration diagrams as an interaction diagram that shows the sequence of messages that implement an operation or a transaction. In Section 3.13 a Component view model is used to visually represent a component and to capture a model’s physical implementation information, such as program files and subsystems. Finally, Section 3.14 uses a deployment diagram to show processors, devices, and connections.
3.7 Use Case
3.8 Prototypes
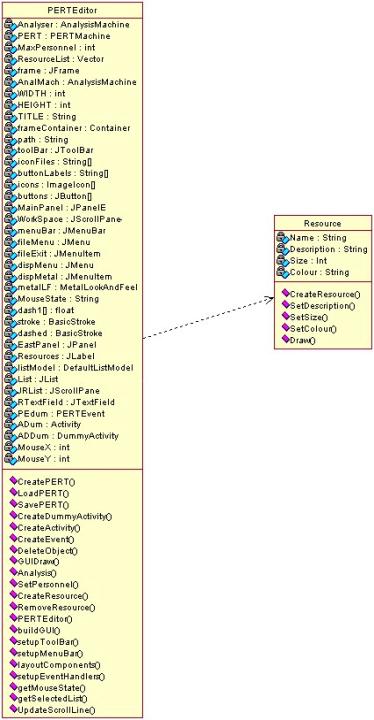
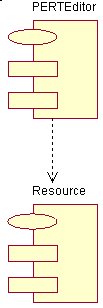
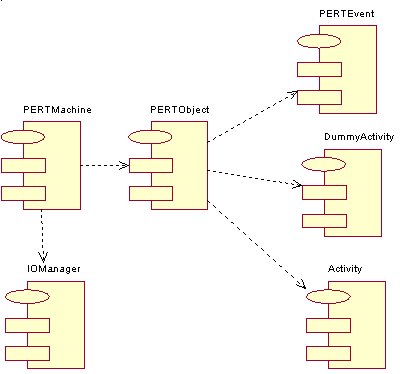
3.9 Class Diagrams
Package PertEditor
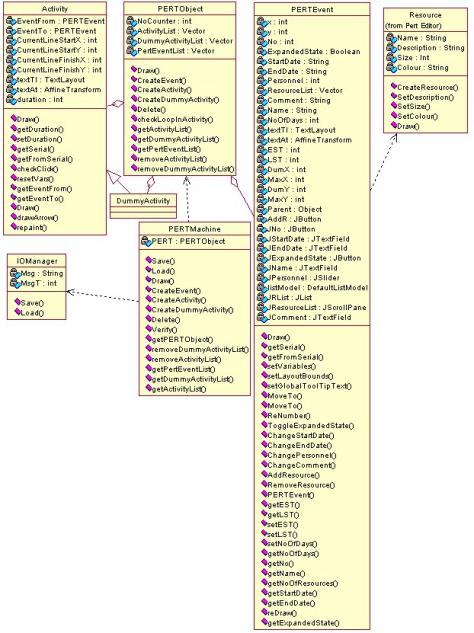
Package PertMachine
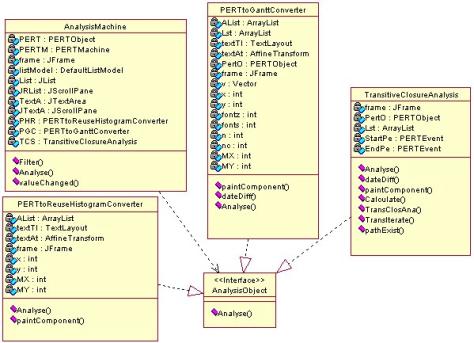
Package Analyzer
3.10 State Diagram
Explanation of GUIDraw method in PERTEditor
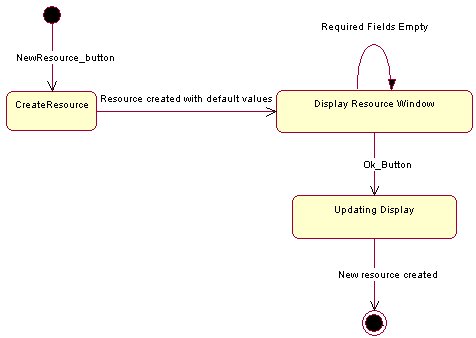
Explanation of CreateResources method in Resource
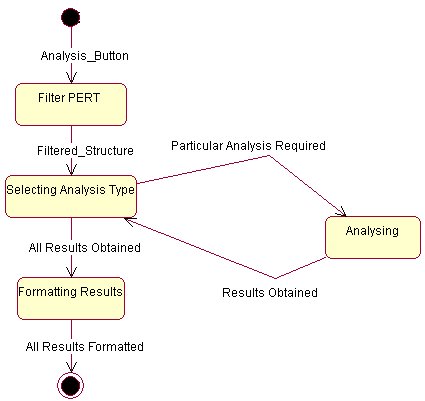
Explanation of Analyze method in AnalysisMachine
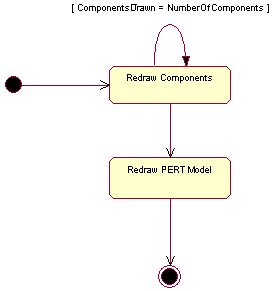
Explanation of Analyze method in PERTtoReuseHistogramConverter
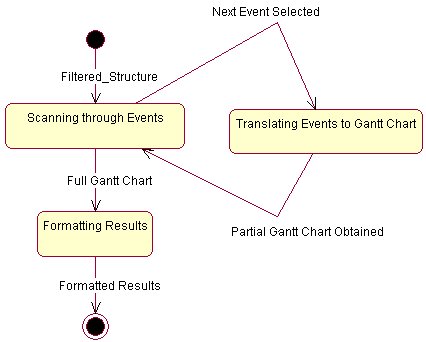
Explanation of Analyze method in PERTtoGanttConverter
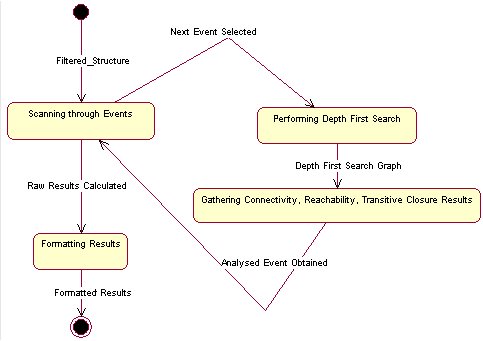
Explanation of Analyze method in TransitiveClosureAnalysis
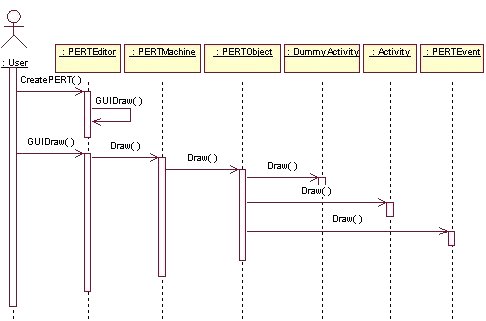
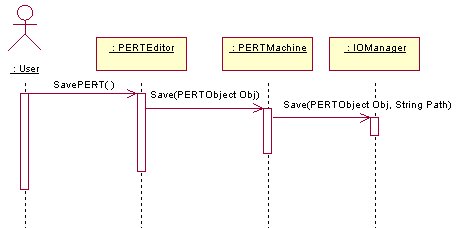
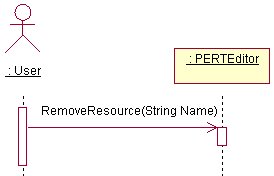
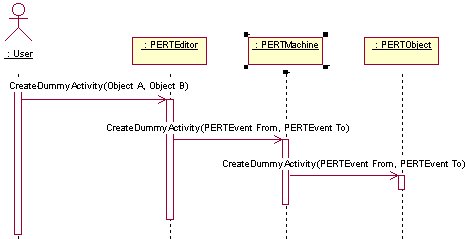
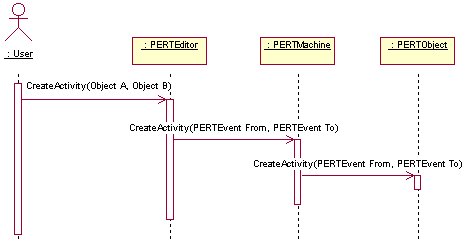
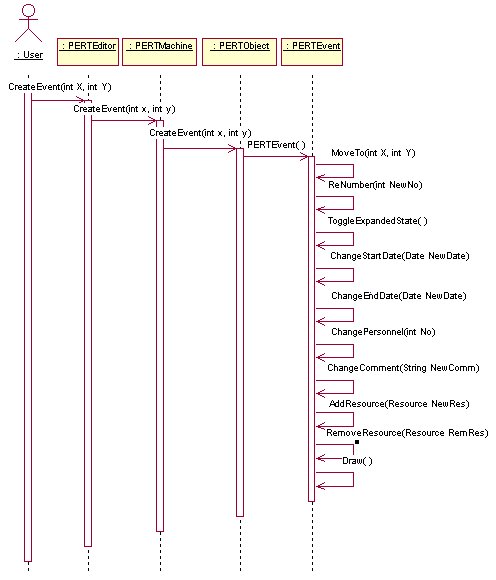
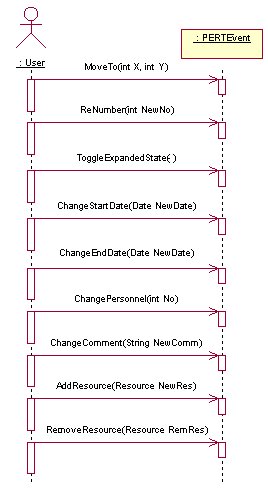
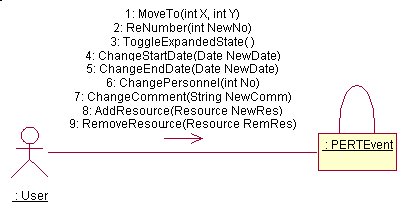
3.11 Sequence Diagrams
New
Save
Load
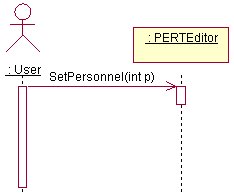
ModifyPersonnel
AddResources
RemoveResources
AddDummyActivity
AddActivity
AddEvent
DeleteObjects
EditEvent
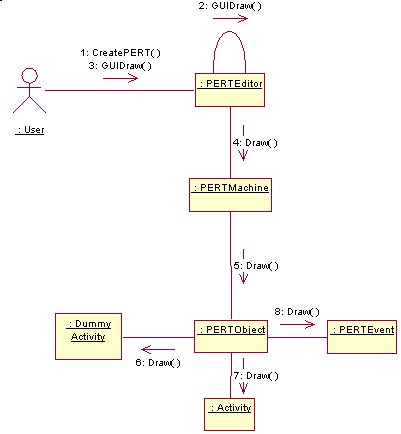
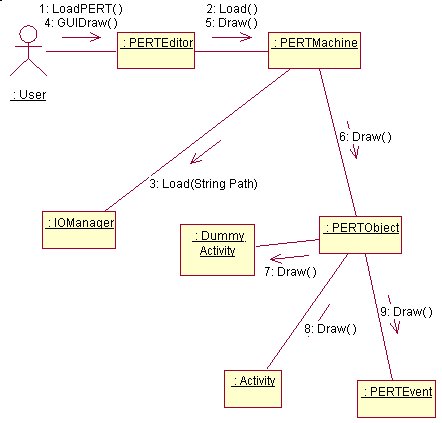
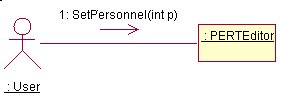
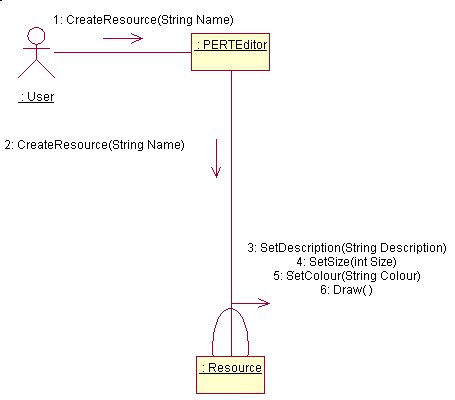
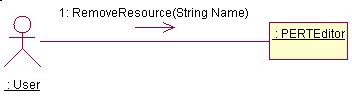
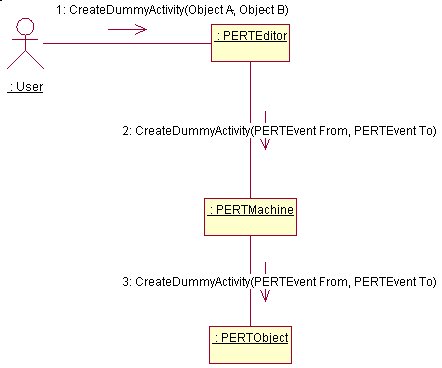
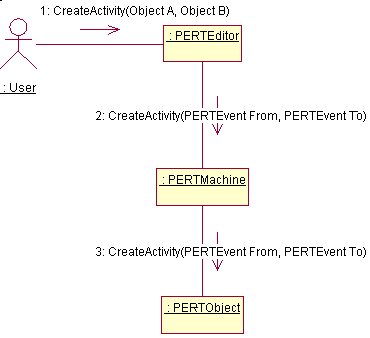
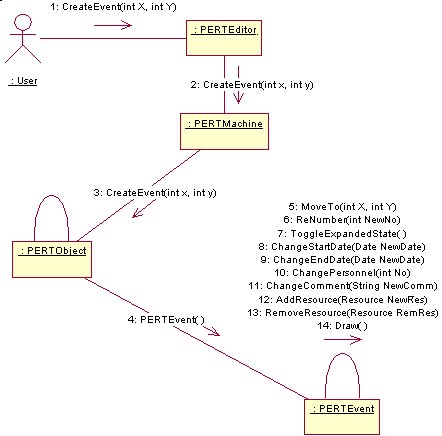
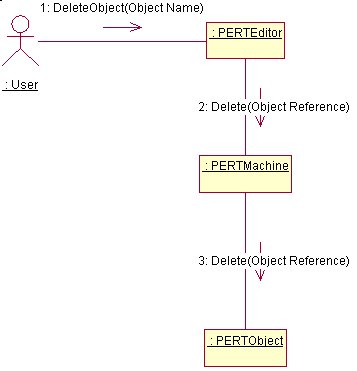
3.12 Collaboration Diagrams
New
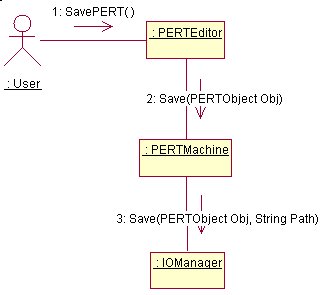
Save
Load
ModifyPersonnel
AddResources
RemoveResources
AddDummyActivity
AddActivity
AddEvent
DeleteObjects
EditEvent
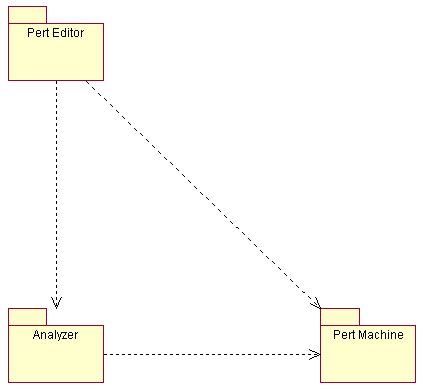
3.13 Component View
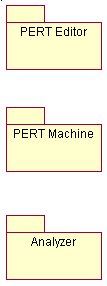
PertEditor
PertMachine
Analyzer
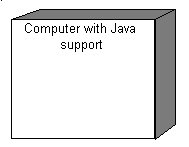
3.14 Deployment Diagram
4. Implementation
4.1 Code Overview
After the Project Scheduling tool was designed, the remaining part was to actually translate it from the paper to the code. Although good Specification and Design tend to facilitate this transition, it is still not a trivial task. The tool which I used for the design (Rational Rose 98 ©) has an option to generate the structure of the code. The structure produced was basically divided into three main packages. The first package called “PERT_Editor” was the central code which tied up the different parts of the application together. It is responsible to offer an easy to use, intuitive user interface, while calling more advanced procedures offered from other packages. The second package called the “PERT_Machine” was the repository which contained instances of a PERTMachine. This object is the entity which handles all components of a PERT model (i.e. activities, events etc.) plus it also gives them certain extra features such as the ability to save themselves to disk as one big object. The third package called “Analyzer”, as its name clearly implies is responsible with all the different analysis required. Once the structure of the code is in place, the next part is to fill it in using Java Code.
4.2 PERT Editor
The PERT Editor is the Alpha and the Omega of this application. Without this main manager, the different pieces of the application would float around uselessly. This program is responsible for :
1. Handling things related to the Graphical User Interface.
a. Setting Up and laying all Graphical User Interface Components (such as Menus, List Boxes, Buttons, Tool-Bar etc).
b. Setting Up the several Event Handlers and handling main user interaction.
c. Calling refreshes where needed.
- Correctly interacting with the other packages found in the program.
- Creating new PERT Machines or Analyzers.
- Invoke methods found in the other Packages.
PERT Editor Code Analysis
The Main Panel
The Main Panel is made up of JScrollPane which contains a JPanelE. A JScrollPane is an object which takes a container as input and adds to it the facility to use scroll bars. A JPanelE is basically a normal JPanel which I extended it in such a way so that I could override the paintComponent(Graphics g) method. This method is responsible for drawing the background of any JPanel. This has the advantages that whenever Activities (or Dummy Activities) are created they are drawn directly onto the JPanel and not on any other object which is then placed on the panel. In this way, the program gains some extra speed since it has less components to redraw.
How an Event is Created
A PERT Event is simply created by the user pressing the Event button and anywhere on the workspace. As soon as the mouse click event is caught, a call is made to the PERT Machine to create the Event and the Event just created is placed on the Main Panel of the PERT Editor.
How an Activity is Created
Once the user presses upon the Activity or Dummy Activity button inside the PERT Editor, a flag is set indicating the value of the button pressed. When the user selects an existing Event, the function CreateActivity is called. This function receives as parameter a reference to an Event Object. In the case that this is the first Event selected, it is placed inside a dummy variable signifying that it is the From Event. If it is not the first Event selected, the function to create and Activity inside the PERT Machine is called, passing the dummy event set beforehand as the From Event and the current Event selected as the To Event. Depending on the flag set at the start either an Activity or a Dummy Activity is created. As soon as at least one Event is chosen, an event handler traps the mouse position and displays a line from the selected Event up to the position of the mouse pointer. This is done by using the Mouse events Move, Clicked etc.
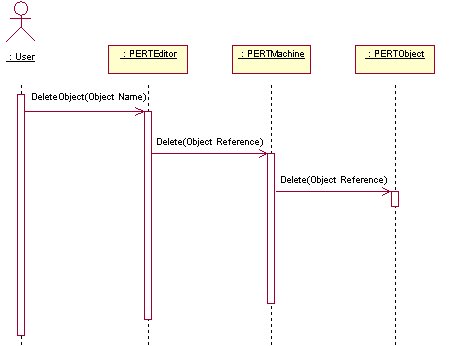
How an Object is Deleted
Object deletion is achieve by calling the DeleteObject function. This function is very powerful and has three main forms.
- DeleteObject()is the most generic function and even the most dangerous. In fact, it is normally called whenever a new object is to be created. It first prompts the user for confirmation, with a friendly warning that if this function will execute, all data will be lost. Then, if the user gives permission for the function to continue, all objects are removed from the Main Panel of the PERT Editor which contains the actual model and they are also removed from the current PERT Machine. (This function is normally called after pressing the new model button).
- DeleteObject(Object name)takes as input the name of the object to delete. (The name is returned as a result of a mouse click on an Event). The procedure first removes any Activities or Dummy Activities which have links to this particular Event. Then, the Event is deleted from the Main Panel of the PERT Editor, and finally, it is removed from the PERT Machine.
- DeleteObject(int MDelX, int MDelY)requires a set of co-ordinates as input. These are actually X and Y co-ordinates of the object to be deleted. The procedure then continues by iterating through all the Activities and the Dummy Activities and calls checkClick() function of the Activity which checks whether the X and Y co-ordinates are on the Activity or not. If they are, the Activity is removed from the Main Panel of the PERT Editor and from the PERT Machine.
Resources
Resources are objects also handled by the PERT Editor. A reference to a resource (normally its name) can be added to a list box. The elements in the list box can be copied to the individual Events as a symbol of being used by the particular Event.
4.3 PERT Machine
The PERT Machine is the code directly related to the PERT Model. In fact the PERT Machine has the function to further enhance the PERT Model with additional features such as the ability to store and retrieve the model as a whole. The PERT Machine makes direct use of two sub classes, one is the PERT Object and the other is the IO Manager. This class has the sole purpose to encapsulate the functions of the PERT Object and the IO Manager under one main class.
IO Manager
This class has two main functions. These are :
· Save the PERT Object – This is achieved by first prompting the user to enter a location and name of the file to save. As soon as the information is gathered, an Output Stream is opened. The procedure then iterates through all the Objects in the PERT Object (i.e. Events, Activities and Dummy Activities) and instructs each object to create a serializable copy of itself. [1] This copy is then sent out into the Output stream to be saved. If any errors occur during this process, the error is trapped and a message is displayed.
- Load the PERT Object – The retrieval process is slightly more complicated than the Save process. First the use is prompted to enter the location and name of the file to Load. As soon as the information is gathered, an Input Stream is opened. Then procedure starts retrieving the Objects. First the Events are created, then the Activities and Dummy Activities are created. Some extra effort is needed because for each Activity (or Dummy Activity) the related Event must me found and a reference to this Event must be stored in the Activity. When all the elements in the Input Stream have been read, the user is notified whether or not the operation was successful.
PERT Object
The PERT Object is the class which manages PERT model related activities as a whole. Although it can create all the components which make up the PERT model (i.e. Events, Activities and Dummy Activities) its main purpose is to perform model related functions. These functions include :
· Calling the redraw method of all the components held within.
· Maintaining sub-components, i.e. Creating and Destroying Events, Activities and Dummy Activities.
· Performs verification and validation routines such as checkLoopInActivity(PERTEvent From, PERTEvent To). This is a very important method which is called before creating any Activity (or Dummy Activity). Its purpose is to detect whether or not the new Activity will create a loop (which according to the rules in Appendix A, loops are illegal) or the activity already exists. This check is achieved by looping through all the Activities and Dummy Activities and performing three checks :
o If the tail and head of the new activity is the head and tail of an existing activity, then it is a loop.
![]()
o If the tail and head of the new activity are equal to an older activity, then it is invalid because it already exists.
o If there exists an Activity where its tail, is equal to the head of the new activity…
Then the method recurses and checks whether there exists a loop between the head of the existing activity and the tail of the new activity.
The recursion continues until either a loop is found or there are no more paths to search. The search will eventually stop because the network is finite and loop free.
PERTEvent
A PERT Event is the object which encapsulates all the methods related to handling Events. The main events handled by this class are :
· Handles maintenance of the Event, i.e. creation, deletion and editing.
· Provides two conversions, to and from serializable state for the Event. This allows the Event to be stored and retrieved easily from disk.
· Builds a Graphical Interface for the Event and handles user interaction such as editing fields, dragging, minimizing and maximizing etc.
· Stores a list of resources.
· Handles verification and validation for the data entered, i.e. check dates etc.
Activity and Dummy Activity
An Activity is the object which handles PERT activities. The Dummy Activity is basically an inheritance of the Activity class with some minor changes such as drawing a dotted line instead of a solid line.
The main events handled by this class are :
· Handles maintenance of the Activity, i.e. creation, deletion and editing.
· Provides two conversions, to and from serializable state for the Activity. This allows the Activity to be stored and retrieved easily from disk.
· Builds a Graphical Interface for the Activity and handles user interaction such as deleting.
Since the Activity is actually a drawing visually, which is not composed of any sub-components, and therefore it does not support user events, the missing methods had to be implemented. The most important is the checkClick(int MDelX, int MDelY) method which takes a co-ordinate as an input and calculates using the “point line distance” function of the Line2D class to find the distance between the point and the line. If the distance is less than 3 pixels[2], then the line can be considered. The line is finally passed under a number of conditions to make sure that the point is actually between the two Events which hold the Activity between them. The Activity has no absolute co-ordinates defined. In fact, it has just two positions relative with the two Events (one at the head and one at the tail) of the Activity.
The drawing method of the activity has a number of conditions which calculates from which side of the events the line should begin. After the sides are found, the center of the events are calculated and the line can be drawn.
4.4 Analyzer
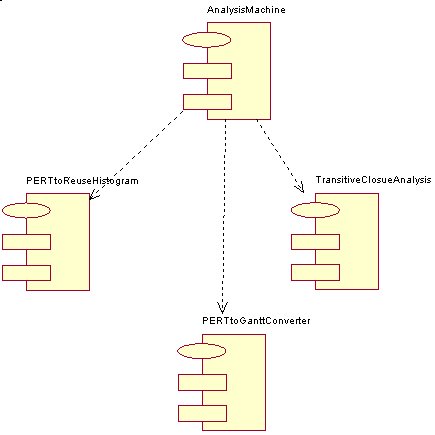
The Analyzer is the class responsible for performing all the analysis. The main manager in this class is the Analysis Machine. It has the main function of filtering any unnecessary data (such as extracting a PERT Object from a PERT Machine), taking care of creating and handling external windows and calling appropriate analysis routines. The Analysis Machine calls the different analysis methods which conform to the Analysis Object Interface. The current implementation offers basically three types of Analysis[3]. These are :
· PERT to Gantt Chart Converter
· PERT to Reuse Histogram Converter
· Transitive Closure Analysis
PERT to Gantt Chart Converter
The analysis begins by iterating through all the Events and
constructing an array of dates. This has the main function of sorting the
elements in the Gantt Chart. As soon as all dates are placed in the appropriate
ordering then all the work is left to the paintComponent(Graphics g) method. This
method is responsible for drawing the background of any JPanel and is called
automatically when there is a refresh. In this way, there is no need of
manually calling refreshes since the Java Window Manager automatically does.
This method is quite simple, first it sets up the headers of the chart, then it
iterates through all the events in the predefined order and simply draws the
events onto the screen at calculated points. This method also caters for variable
amount of elements in the chart and whenever the number of elements is large,
it also takes care to scale down the fonts. Another feature is the ability to
scale the whole display whenever a window resize occurs.
PERT to Reuse Histogram Converter
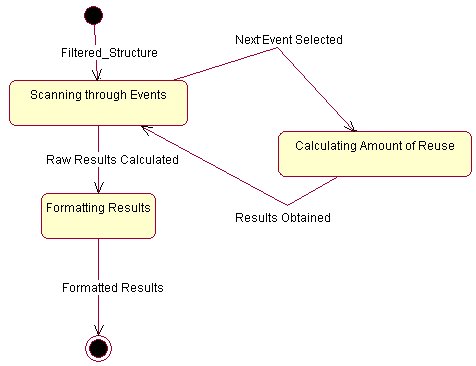
The analysis begins by iterating through all the Events and constructing an array of dates. This has the main function of sorting the elements in the Gantt Chart. In the case that in a particular date there is more than one component reused[4], the date is repeated n times. This tend to signify the amount of reuse employed that day. As soon as all dates are placed in the appropriate ordering and the dates with more than one reusable component are duplicates, then all the work is left once again to the paintComponent(Graphics g) method[5]. This method is also quite simple, first it finds the maximums for the diagram i.e. the maximum amount of reusable components employed and the max number of events[6]. The method continues by iterating through the previously calculated list, retrieve each day, and for each day calculate the number of reusable components[7]. As soon as all calculations are done, the histogram bar for the day is displayed. The loop continues until all the elements are drawn.
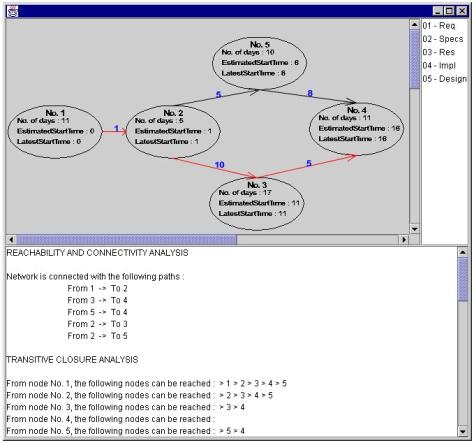
Transitive Closure Analysis
The analysis begins by first calculating the critical path
of the network (for a complete description, refer to Appendix B). Then all the
remaining work is left once again to the paintComponent(Graphics g) method[8].
This method then iterates through all the Events, Activities and Dummy
Activities and calls the reDraw() method for each Event and the rePaint() method for the
Activities. These methods are almost the same as the ones used by the PERT
Editor to perform a screen refresh except for the reDraw() method of the
Events Object. This method gives the PERT Event a new visual outlook. In fact,
instead of the normal box, the PERT Event is drawn as a circle with the
following information:
· The Event Number.
· The duration or number of days the event will take.
· The Estimated Start Time. (Refer to Appendix B)
· The Latest Start Time. (Refer to Appendix B)
The Graphical User Interface presented to the user has an additional two sections. One section containing a list of Events and the other section containing the Analysis Result. The list of Events section allows the user to select on which Events the analysis will be made. Every time the selected items are changed, the results are calculated in real time. The Analysis performed are basically two, one is connectivity and the other is transitive closure.
Connectivity
The Connectivity analysis is performed by iterating through
all the Activities and checking whether there exists activities between the
elements of the selected list. If the number of such elements is greater or
equal to the number of (Events – 1) then the network is connected. Also a
function pathExist() is used to check whether there exists a path between the
Activities found in the previous routine. This is achieved by first of all
finding the starting Event and end Event. Then a loop starts which iterates
through the list of events found previously, starting from the first one and
stops only if the last one is found or if it reaches a dead end without
covering all nodes. In this way, the program can decide whether or not the
network is connected.
Transitive Closure
The Transitive Closure is calculated by iterating through the selected events and for each event the function TransIterate() is called. This function is a recursive function which works by finding the nodes (or children of the current Event) reachable from the current Event and calls the same function by using the children just found. In this way by using depth first search, all nodes reachable are found.
4.5 Problems Encountered
The problems encountered during the implementation of this project are various and some of them are due both to the complexity of the project and due to lack of documentation. The following is just a small summary of the major stand stills encountered during the project implementation.
Complexity Problems
Most complexity problems were related to the lack of Graph support offered from the Java language. In fact to produce Charts and Graphs, tedious and time consuming calculations had to be performed. Java in fact does not offer any package for this purpose. The only application programming interface available is the Java 2D, which although worked fine was certainly not easy to work with. Another problem, which seems trivial but in fact is quite enormous is how to draw a decent arrow at the end of every line. Since a line can continuously change angle, the arrow must too change its angle. A partial solution was to use an arrow mage up of circles, i.e.
![]()
This solved the problem since the only calculations needed were the center of the circle which could be easily calculated. Although this was a plausible solution, it wasn’t neat, and therefore, I began researching haw to draw an arrow which could be rotated easily. The solution was easy whenever the line was horizontal or vertical, since it was just a matter of subtracting and adding specific amounts. The problem was when the line was at an angle.
![]()
This was solved by finding an point on the line a relative distance away from the head of the arrow.
![]()
Then, a line is obtained with an inverse gradient which passes through that point.

Finally, two points are found on that line, one positive and the other negative, which when they are joined to the head of the line form an arrow.

Documentation Problems
These kind of problems are problems which occur not because of lack of literature, but because sometimes, the developer requires some additional function which seems obvious that it exists but for some strange reason is not documented or is not implemented. One such function is the date difference function. This is basically a function which is found in most languages, and simply returns the number for days between two dates, but is not present in Java. There are other ways of calculating it but is not practical implementing it without using the Java date functions since they handle easily leap years, and other calendar problems. Well, the Java Application Programming Interface does not offer any such function. In fact after researching several books, I logged onto the Java web site and in the developer’s forum, I found a solution. This is implemented in the function dateDiff() and involves using the getTime() method offered by Java to return the number of milliseconds since January 1, 1970, 00:00:00 GMT represented by this Date object. The number of milliseconds of the other date is also calculated, the two amounts are subtracted and the result is divided by (1000 * 60 * 60 * 24)[9] to get the number of days.
Another problem was encountered when I tried to serialize the PERT Object. In fact my initial plan was to use as much as possible basic serializable components, then call the serializing function and save everything to disk. This did not happen and the main reason is due to a bug in Java. Java has a tool called serialver, whose purpose is to verify that the object is serializable. When I tried this tool, it reported that the object could be serializable but when I actually tried to serialize it, problems arouse. After consulting with the Java forum over the Internet, I found out that it was a problem with Java. Therefore, I had to implement my own serializing routines.
Apart from these other problems were encountered which were resolved quite easily. These are the major ones which I think should be noted in this document.
5. Evaluation
Testing
As soon as the program was ready, it was exposed to sever testing. This included using and misusing the several parts of the program such as:
· Loading wrong files (i.e. with a different format)
- Drawing a large number of events and activities.
- Trying to produce loops in the network.
- Trying to delete overlapping objects.
- Performing analysis over different networks, some of which incomplete.
- Using resources.
- Changing dates in Events.
The defects which were found were corrected immediately. These defects included, a mathematical error in the plotting of the Gantt Chart etc. Other defects were related to the presentation of the data. In fact, even though the reuse histogram works correctly, whenever the number of elements increased to a size which could not be handled, all the data would be squashed together. This was resolved by limiting the amount of data visible. The program also did not produce user notifications. In fact whenever an error occurred, the user was not appropriate notified. This was solved by using dialogues whenever necessary. The buttons had another visual defect, whenever a user pressed one of them, he could not know which one was pressed. This was solved by changing the icon of the pressed button with one embossed which gives the impression of a button sticking out.
A rather important defect was discovered after calculating the critical path. In fact, since the duration of any Activity was stored in the previous Event date range, this produced a network with all paths critical. To solve this problem, the user was given the facility to change the duration of an Activity by clicking on the Activity. In this way, even though an Activity had a specific date range for completion, it was not bound to that period and could take any amount of time.
Strengths and Weaknesses
The program is quite robust at this time. In fact it is quite sensible to how the data is entered. It does not allow any end date in an event to occur before a start date. All the objects in the Editor can be moved around without any constraints what so ever. Activities are dynamic enough to change relative to their respective Event, and therefore always leave a neat display. The Interface is quite simple and straight forward to use. Resources can be added easily. The storing and retrieving of the model is also very simple and conforms to Graphical User Interface standards. The Analysis part of the program requires minimal user intervention. The weaknesses of the program are small things which do not prevent the program from working correctly but they can hinder its usability. One major weakness is when the model scales to a very large size, the components can become easily squashed, especially when considering that on a normal screen, only about ten expanded Events can be seen simultaneously. Obviously, the program allows the user to scroll the display but it would have been much more usable if the Event would be redesigned to a smaller component. Another weakness is performance. When drawing large networks and especially during analysis, the calculations employed can slow the system down.
Extent of Achievement
The program as a whole reached its intended goals. In fact, all basic requirements were satisfied. Even though as we specified beforehand, the program contains some minor weaknesses, they by no mean defy the scope of the project. The tool can be used without any problem, and also allows for quite reasonable networks to be drawn. The type of Analysis is complete and allows the user to visualize graphically the project by using Gantt Charts. It also allows a user to understand where his resources are being employed and where there will be a possibility of congestion. This is seen using the Reuse Histogram. Finally but not least, the transitive closure analysis allows the user to find any dead-ends in the project path. Overall, the program is user friendly and I believe the analysis provided is enough to conduct some serious project planning.
6. Future Work
Every existing program can always be enhanced and this is certainly not an exception. New features can be added, either to accommodate the user by enriching the user interface and therefore make the design even more usable or by adding new features to the existing. I had many ideas regarding what extra cool features I could add to the project but unfortunately, as every project I had time restrictions to abide with and therefore had to limit myself to the current version. This version is fully functional and meets all the predefined needs of the prospective user.
PERT Editor Enhancements
The Editor should offer a larger panel where to draw the PERT diagram. The resources should be employed better and used for more valuable processing. Also, a printing feature can be added to allow the user to have hard copies of the diagram.
PERT Machine Enhancements
More information should be stored in all the PERT Objects. This can be used to add additional functions and reporting. In the Event object, there exist a scroll pane which holds the number of employees. This is used just to keep a record of the number of employees. A better use should be found for it.
Analysis Enhancements
The additional work which can be implemented mainly regards efficiency of the algorithms used to draw the diagrams. The Gantt chart can be made more customizable and allows the date intervals to be defined by the user. Also, the panel should not be a fixed size but a variable size panel which scrolls both vertical and horizontal. The Reuse Histogram should be implemented more efficiently. The algorithm tends to slow when the number of Events is high. The Transitive Closure analysis is fast but unfortunately, it takes several iterations to perform its calculations. There exists algorithms which do the same in one or two passes.
Every effort has been made to make future enhancements as easy as possible. The structure used is dynamic enough to allow the insertion of new features with a minimal amount of code change. The above are just some ideas, in fact the amount of features or enhancements is practically endless and is only limited to the developer’s resources.
7. Conclusion
The Tool for Project scheduling is a very powerful and useful tool. In fact, it should be used most of the time before starting any software engineering project. Developing the tool made me appreciate more its importance. In fact, I learnt that without adequate project scheduling, no project can reach fruition within the agreed period. The project did not only give me more insight and experience on the software engineering process but gave me something that no one could have taught me. I learnt that especially during software development, many unexpected problems tend to crop up. Sometimes, these problems are really funny because they arise from stupid syntactical mistakes, but most of the times, they are frustrating and make the developer want to quit up everything. As always everybody has a choice in life, and the choice I made which proved me right was to persist over the problem instead of leaving it. Most of the problems could not be directly found on books. Even though fortunately, my fellow colleagues were always helpful, most of the time we found ourselves in the same waters and therefore couldn’t be of much support to each other. This fact was not a drawback but a stimulus to conduct more research else where. In fact, one of the most informative channel I found was the Internet. Through it, I not only came in contact with people and forums I did not know, but also with the solutions to most of my problems.
The project had the main purpose of developing a graphically oriented tool for the planning, controlling and management of the software engineering process. It is based around the PERT model but extracts from it Gantt Charts, Reuse Histograms, and Transitive Closure Analysis. All these have been achieved in the program. Some difficulties encountered during development made me appreciate more the use of the software engineering principles. In fact, the design was followed faithfully and only changed occasionally when the functions grew large and had to be sub-divided for the sake of clarity. The project which is built from reusable programming blocks also made me appreciate more the use of reusable components. These components required minimum testing and worked almost instantly with minimum settings.
Overall, I must confess that the project was a tough experience which truly tested my personal limits. This not only helped me enrich my skills but also taught me several important lessons. Even though there are some of the things I would have liked to do differently (provided I had some extra time), I do not look at the things I did with regret, but more as a lesson which I learnt for the future. I am happy with the finished product because it satisfies all expectations and in some cases goes beyond them. It also reaches my personal limits of quality. Every effort has been made to make the product as easy as possible to use and difficult to misuse. I hope that every future user is satisfied with the product as much as I am. This was not just a project which will hopefully help me earn my Degree, but more a sort of real life experience in which I will be faced with limits and expected to produce good work, for which I am very grateful !
Appendix A
Introduction to Program Evaluation and Review Technique (PERT)
Network analysis is a generic term for a family of related techniques developed to aid management to plan and control projects. These techniques show the inter-relationship of the various jobs or tasks which make up the overall project and clearly identify the critical parts of the project. They can provide planning and control information on the time, cost and resource aspects of a project. Network analysis is likely to be of most value where projects are:
a) Complex, i.e. they contain many related and interdependent activities, and/or
b) Large, i.e. where many types of facilities, high capital investments, many personnel are involved; and/or
c) Where restrictions exists, i.e. where projects have to be completed within stipulated time or cost limits, or where some or all of the resources (material, labor) are limited.
Basic Network Terminology
Activity
This is a task or job of work which takes time and resources e.g. Build a Wall, Verify the debtors in a sales ledger, Dig foundations etc. An activity is represented in a network by an arrow thus:
![]()
The head of the arrow indicates where the task ends and the tail where the tasks begins. The arrow points from left to right but is not drawn to scale. An essential preliminary to the use of network analysis is establishing.
a) what activities are involved in the project.
b) their logical relationship e.g. the activity of Building a Wall must take place after the activity, Dig Foundations.
c) an estimate of the time the activity is expected to take. Note that the basic time estimate is always necessary but in addition other estimates of times, costs, resources probabilities etc may also be required. These other factors are dealt with later.
Event
This is a point in time and indicates the start or finish of an activity, or activities, e.g. Debtors verified, Foundations Dug etc. An event is represented in a network by circle or node thus:
![]()
It will be noted that the establishment of activities automatically determines event because they are the start and finish of activities and represent the achievement of Specific stage of a project.
Dummy activity
This is an activity which does not consume time or resources. It is used merely to show Clear, logical dependencies between activities so as not to violate the rules for drawing, networks. It is represented on a network by a dotted arrow thus:
![]()
Note that dummy activities are not usually listed with the real activities but become necessary as the network is drawn. Dummy activity examples are given after the rule for drawing networks have been discussed.
Network
This is the combination of activities, dummy activities and events in logical sequence according to the rules for drawing networks. Thus, a small network might appear as follows:
Rules for drawing networks
The following rules are all logically based and should be thoroughly learned before attempting to draw networks.
a. A complete network should have only one point of entry — a start event and only one point of exit a finish event.
b. Every activity must have one preceding or ‘tail’ event and one succeeding or ‘head’ event. Note that many activities may use the same tail event and many may use the head event, e.g.
However an activity must not share the same tail event and the same head event with any other activities.
c) No activity can start until its tail event is reached.
d) An event is not complete until all activities leading in to it are complete. This is an important rule and invariably has to be applied in examination questions.
e) ‘Loops’ i.e. a series of activities which lead back to the same event are not allowed because the essence of networks is a progression of activities always moving onwards in time.
f) All activities must be tied into the network i.e. they must contribute to the progression or be discarded as irrelevant. Activities which do not link into the overall are termed ‘danglers’.
Conventions for drawing networks
In addition to the Rules above, which must not be violated, conventions are usually observed and for the sake of uniformity and easier communication it is recommended to follow the normal conventions.
a) Networks proceed from left to right.
b) Networks are not drawn to scale i.e. the length of the arrow does not represent time elapsed.
c) Arrows need not be drawn in the horizontal plane but unless it is totally unavoidable they should proceed from left to right.
d) If there are not already numbered, events or nodes should be progressively numbered from left to right. Simple networks may have events numbered in sample numeric progression i.e. 0, 1, 2, 3 etc but larger, more realistic networks may be numbered in ‘fives’ i.e. 0, 5, 10, 15 etc or ‘tens’ i.e. 0, 10, 20, 30 etc. This enables additional activities to be inserted subsequently without affecting the numbering sequence of the whole project.
Reference [LUCE 96]
Appendix B
Introduction to Critical Path Method (CPM)
However sophisticated the time analysis becomes, a basic feature is always the calculation of the project duration which is the duration of the critical path.
Critical path.
The critical path of a network gives the shortest time in which the whole project can be completed. It is the chain of activities with the longest duration times. There may be more than one critical path in a network and it is possible for the critical path to run through a dummy.
Earliest start
times (EST)
Once the activities have been timed, it is possible to assess the total project time by calculating the EST’s for each activity. The EST is the earliest possible time at which a succeeding activity can start and the method of calculation will be as follows :
a) The EST of a head event is obtained by adding onto the EST of the tail event the linking activity duration starting from Event 0, time 0 and working forward through the network.
b) Where two or more routes arrive at an event the longest route time must be taken.
c) The EST in the finish event is the project duration and is the shortest time in which the whole project can be completed.
Latest
start times (LST).
To enable the critical path to be isolated, the LST for each activity must be established. The LST is the latest possible time at which a preceding activity can finish without increasing the project duration. The method of calculation will be as follows :
a) Starting at the finish event, insert the LST and work backwards through the network deducting each activity duration from the previously calculated LST.
b) Where the tails of two activities join, the lowest number is taken as the LST.
Critical path
The activities along the critical path are vital activities which must be completed by their EST’s/LST’s otherwise the project will be delayed. The non critical activities have spare time or float available. If it is required to reduce the overall project duration then the time of one or more of the activities on the critical path must be reduced perhaps by using more labor, or more or better equipment or some other method of reducing job times.
Reference [LUCE 96]
Appendix C
Structured Specification Conventions
Data Flow Diagrams
As information moves through software, it is modified by a series of transformations. A data flow diagram (DFD) is a graphical technique that depicts information flow and the transforms that are applied as data move from input to output. The DFD is also known as a data flow graph or a bubble chart.
The data flow diagram may be used to represent a system or software at any level of abstraction. In fact, DFDs may be partitioned into levels that represent increasing information flow and functional detail. Therefore, the DFD provides a mechanism for functional modeling as well as information flow modeling.
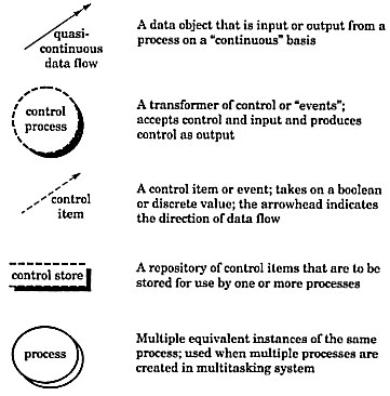
The basic notions used to create a DFD are:
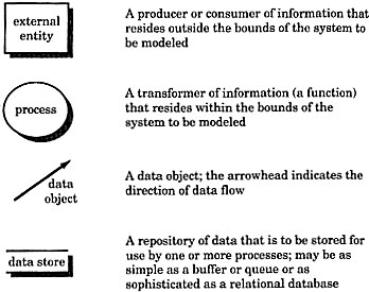
A Ward and Mellor extend basic DFD notations to accommodate demands imposed by real-time systems. The extended notations used are:
Data Structure
Diagram
For any programming problem (not involving parallel activities) structure diagrams may be drawn consisting of just 3 basic construct types:
· Sequence
· Iteration (loop)
· Selection (choice)
A Sequence
Component (box) A is a sequence. Boxes B and C represent component parts of the sequence. In this case they are not further defined and hence have no ‘structure’ of their own; they are known as elementary components.
In the above example, A is a sequence of the two components B followed by C. The notation could of course be extended for a sequence of any number of component parts.
An Iteration
Component (box) E Is an iteration. The box F is the iteration component part. E Is an iteration of a number (possibly zero) of Fs. The number of Fs is controlled by the specified condition.
A Selection
Box X is a selection. Boxes Y and Z are component parts of the selection.
In the example below, X is a selection (or choice) of Y or Z. Only the condition for the choice of Y is specified - if this condition is not true Z is chosen.
Entity-Relationship (ER) Diagrams
Finite State
Machines
A Finite State Machine (FSM) is a formalized notation used to model Control Flow. This kind of notation is extremely simple to use and very intuitive.

![]()
A FSM is made up of three components:
· Finite set of states S
· Finite set of inputs I
· A transition function S x I è S
Also, a FSM can have output signals. These can be seen as an outcome of specific transitions.
Appendix D
User Guide
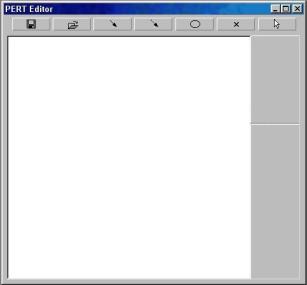
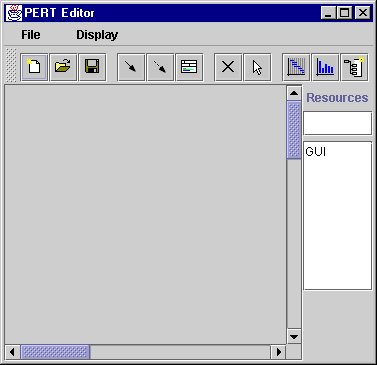
The PERT Editor
The PERT Editor is basically made up of the following window. It follows all normal window conventions .i.e. it has three buttons which are minimize, maximize and close.
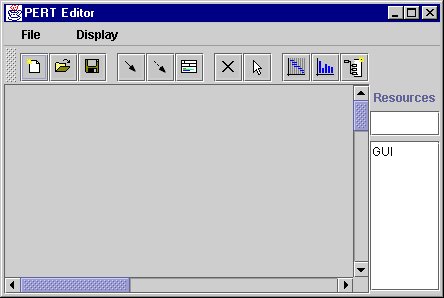
The menu bar has basically two options :
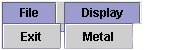
If File > Exit is chosen, the program terminates.
If Display > Metal is chosen, the display is changed provided it is not already metal.
Resources
The resource option allows the user to enter a new resource by typing in its name.

After the name is entered, the user just presses Return.

After the name is entered, the user just presses Return.
To delete a resource, simply double click on its name.

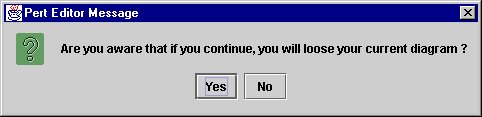
New Model
To create a new model, all that is required is to press the ![]() button.
button.
If a Model already exists and is going to be deleted, the following message appears:
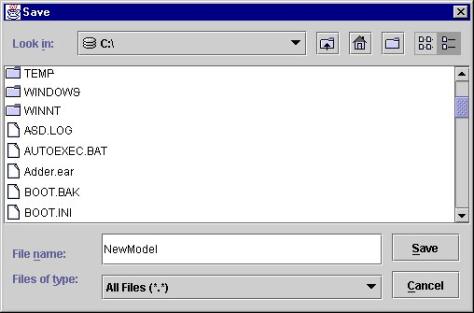
Save Model
To save a model, all that is required is to press the ![]() button. The following windows pops up where
the user is asked to select the path where to store the file and enter the file
name. In the case an error occurs, a message box warns the user.
button. The following windows pops up where
the user is asked to select the path where to store the file and enter the file
name. In the case an error occurs, a message box warns the user.
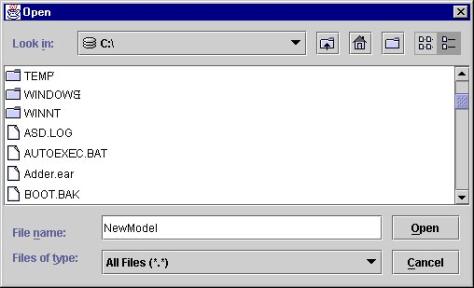
Load Model
To load a model, all that is required is to press the ![]() button. The following windows pops up where
the user is asked to select the path from where to load the file and enter the
file name. In the case an error occurs, a message box warns the user.
button. The following windows pops up where
the user is asked to select the path from where to load the file and enter the
file name. In the case an error occurs, a message box warns the user.
New Event
To create a new Event, all that is required is to press the ![]() button. The button changes colors indicating
that it is chosen, and the user simply clicks anywhere onto the work area. A
PERT Event is created.
button. The button changes colors indicating
that it is chosen, and the user simply clicks anywhere onto the work area. A
PERT Event is created.
PERT Event
A PERT Event has the following form :
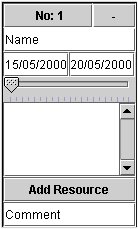
· The top part is the title bar which contains the Event Number. The user clicks on this part to drag the Event around.
- The – sign on the top-right corner indicates that the PERT Event is in the maximum state, and that all details are visible. To hide some of the details simply press on this sign, and the Object should shrink and the sign turn to a + meaning that the PERT Event has some extra details hidden. To maximize it again, simply press on the + sign.
- The Name field contains the Name of the Event and is used to reference the Event. This should be different for every Event.
- The left most date is the start date, while the right most date is the end date. Remember that a start date must always occur before an end date. If not, a warning message pops up.
- The sliding bar is the personnel bar, and the number of personnel working of the project is set by sliding it.
- The list box contains a list of resources. If it contains any, simply double click on the name of the resource to remove it from the list.
- The Add Resource is used to add a resource to the list box mentioned in the previous point. Before clicking this, remember that a resource must be selected from the main window of the PERT Editor.
- The Comment field contains a simple general comment.
New Activity
To create a new Activity, all that is required is to press
the ![]() button. The button changes colors indicating
that it is chosen. The user then simply clicks on any two Event numbers to
create the activity.
button. The button changes colors indicating
that it is chosen. The user then simply clicks on any two Event numbers to
create the activity.
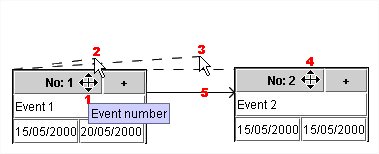
1. Click on Event Number.
- Move the mouse.
- Continue moving until it is on the next Event.
- Click on the next Event Number.
- An arrow is created.
New Dummy Activity
To create a new Dummy Activity, all that is required is to
press the ![]() button. The button changes colors indicating
that it is chosen. The user then simply clicks on any two Event numbers. The
procedure is the same as New Activity.
button. The button changes colors indicating
that it is chosen. The user then simply clicks on any two Event numbers. The
procedure is the same as New Activity.
Edit Activity
To Edit the duration of an Activity, simply click any where on the activity and the following window will pop up…
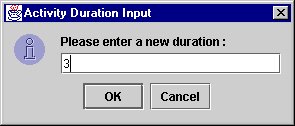
The new duration appears as a blue number on the duration itself.
Delete
To Delete any Object, all that is
required is to press the ![]() button and click on any object. If the Object is an event, the user must press on
the Event Number to delete it. If the object is an Activity or a Dummy Activity,
the user simply presses anywhere onto the activity.
button and click on any object. If the Object is an event, the user must press on
the Event Number to delete it. If the object is an Activity or a Dummy Activity,
the user simply presses anywhere onto the activity.
Gantt Chart
To create a Gantt Chart of the model,
all that is required is to press the ![]() button. Immediately, a window pops up showing
the chart.
button. Immediately, a window pops up showing
the chart.
Reuse Histogram
To create a Reuse Histogram of the
model, all that is required is to press the
![]() button. Immediately, a window pops up showing
the histogram.
button. Immediately, a window pops up showing
the histogram.
Transitive Closure Analysis
To perform a Transitive Closure of
the model, all that is required is to press the ![]() button. Immediately, a window pops up
showing the Analysis. To change the parts of the network under analysis, simply
select which Events to analyze from the list box on the right. Immediately, the
text box at the bottom will show the analysis. If on the PERT Chart, there is a
red path, this indicates that the path is a critical path.
button. Immediately, a window pops up
showing the Analysis. To change the parts of the network under analysis, simply
select which Events to analyze from the list box on the right. Immediately, the
text box at the bottom will show the analysis. If on the PERT Chart, there is a
red path, this indicates that the path is a critical path.
Bibliography
|
|
|
|
|
[BEHF 96] |
Author : |
Ali Behforoz, Frederick J. Hudson |
|
|
Name : |
Software Engineering Fundamentals |
|
|
Edition : |
1 st |
|
|
Publisher : |
Oxford University Press |
|
|
ISBN : |
0-19-510539-7 |
|
|
|
|
|
[BENN 99] |
Author : |
Simon
Bennett, Steve McRobb, Ray Farmer |
|
|
Name : |
Object
Oriented Systems Ananlysis and Design using UML |
|
|
Edition : |
1 st |
|
|
Publisher : |
McGraw
Hill |
|
|
ISBN : |
0-07-709497-2 |
|
|
|
|
|
[ELMA 94] |
Author : |
Elmasri,
Navathe |
|
|
Name : |
Fundamentals
of Database Systems |
|
|
Edition : |
2 nd |
|
|
Publisher : |
Addison
Wesley |
|
|
ISBN : |
0-8053-1753-8 |
|
|
|
|
|
[EPPS 95] |
Author : |
Susanna S. Epp |
|
|
Name : |
Discrete Mathematics with Applications |
|
|
Edition : |
2 nd |
|
|
Publisher : |
Brooks\Cole Publications |
|
|
ISBN : |
0-534-94446-9 |
|
|
|
|
|
[ERIK 98] |
Author : |
Hans-Erik
Eriksson, Magnus Penker |
|
|
Name : |
UML
Toolkit |
|
|
Edition : |
1 st |
|
|
Publisher : |
Wiley
Computing |
|
|
ISBN : |
0-471-19161-2 |
|
|
|
|
|
[INCE 97] |
Author : |
Darrel Ince |
|
|
Name : |
Software Engineering, A practitioner’s Approach |
|
|
Edition : |
4 th |
|
|
Publisher : |
Pressman |
|
|
ISBN : |
0-07-709411-5 |
|
|
|
|
|
[JEEV 00] |
URL : |
http://www.ask.com/ |
|
|
|
|
|
[LUCE 96] |
Author : |
T Lucey |
|
|
Name : |
Quantitative Techniques |
|
|
Edition : |
5 th |
|
|
Publisher : |
DP Publications |
|
|
ISBN : |
1-85805-183-5 |
|
|
|
|
|
[MCDE 94] |
Author : |
John McDermid |
|
|
Name : |
Software
Engineering Reference Book |
|
|
Edition : |
1 st |
|
|
Publisher : |
Butterworth
Jeinemann Ltd |
|
|
ISBN : |
0-7506-0813-7 |
|
|
|
|
|
[MEIL 88] |
Author : |
Meilir
Page Jones |
|
|
Name : |
The
practical guide to Structured Systems Design |
|
|
Edition : |
2 nd |
|
|
Publisher : |
Prentice
Hall International |
|
|
ISBN : |
0-13-890777-6 |
|
|
|
|
|
[MNDT 00] |
URL : |
http://www.mindtools.com/critpath.html |
|
|
|
|
|
[MODE 96] |
Author : |
Martin
E. Modell |
|
|
Name : |
A
Professional's Guide to Systems Analysis |
|
|
Edition : |
2 nd |
|
|
Publisher : |
McGraw
Hill |
|
|
ISBN : |
0-070-42948-0 |
|
|
|
|
|
[RATI 00] |
URL : |
|
|
|
|
|
|
[PFLE 98] |
Author : |
Shari, Lawrence, Pfleeger |
|
|
Name : |
Software Engineering Theory and Practice |
|
|
Edition : |
1 st |
|
|
Publisher : |
Prentice Hall |
|
|
ISBN : |
0-13-624842-X |
|
|
|
|
|
[SCHA 97] |
Author : |
Stephen
R. Schach |
|
|
Name : |
Software
Engineering with Java |
|
|
Edition : |
1 st |
|
|
Publisher : |
Irwin
Book Team |
|
|
ISBN : |
0-256-24167-8 |
|
|
|
|
|
[SOMM 98] |
Author : |
Ian
Sommerville |
|
|
Name : |
Software
Engineering |
|
|
Edition : |
5 th |
|
|
Publisher : |
McGraw
Hill |
|
|
ISBN : |
0-201-42765-6 |
|
|
|
|
|
|
|
|