|

MKSOFT
All
rights reserved, 2004
©
DolakhaNepal
Check
your emails:
Hotmail
Yahoo
|
|
District Boundary
|
East
|
: Solukhambhu and
Ramechhap district
|
|
West
|
: Sindhupalchok and
Kavreplanchauk districts
|
|
North
|
: China (Tibet)
boarder
|
|
South
|
: Ramechhap district
|
2.
Location
|
North Latitude
|
: 270
28" - 280 0"
|
|
East longitude
|
: 280
50" - 860 32"
|
|
Region
|
: Central development
region.
|
|
Zone
|
: Janakpur
|
|
District
|
: Dolakha
|
|
Head quarter
|
: Charikot .
|
|
Distance for capital
|
: 133 km.
|
3. Total area of the
district : 2191 Sq.
Km.
4. Distance from capital : 133 km.
5. Highest peak of the district : 7134 m (Gaurishankar)
6. Lowest place of the district : 732 m (Sitali)
7. Political division :
|
No of constituency
|
: 2
|
|
No of Illaka (Area)
|
: 11
|
|
No of Municipality
|
: 1
|
|
No of VDCs
|
: 51
|
8. Land utilization
|
Total arable land
|
: 56683 (26.45%)
|
|
Total forest area
|
: 101500 (47.37%)
|
|
Total pastureland
|
: 29500 Ha. (13.77%)
|
|
Total snow land
|
: 5665 Ha. (2.64%)
|
|
Total barren land
|
: 13740 Ha (6.41%)
|
|
Area coverage by water
|
: 7068 Ha (3.30%)
|
|
Others
|
: 131 Ha (0.06%)
|
|
Total
|
: 214287 Ha (100%)
|
9. Land holdings
|
Ladles
|
: 398 HH
|
|
Land with 3 Ropanies
|
: 7100 HH
|
|
Land with 3 to 10
Ropaniss
|
: 14412 HH
|
|
Land with 11 to 20
Ropanis
|
: 10979
|
|
Land with 20 to 30
Ropanis
|
: 4932 HH
|
|
More than 30 Ropanis
|
: 2124 HH
|
|
Total
|
: 39945 HH
|
|
10. Population
|
: 217218 (2001(A.D. )
|
|
Male
|
: 108170
|
|
Female
|
: 109048
|
|
Total House holds
|
: 39945
|
|
Average femily Size
|
: 5.43/HH
|
|
Population density
|
: 91.14 Person/ sqkm.
|
|
Population grwth rate
|
: 2.5 %
|
11.Profession
|
Agriculture
|
: 91.90%
|
|
Administration
|
: 0.8%
|
|
Technician
|
: 1.40 %
|
|
Industries/Productive
|
: 4.70%
|
|
Others
|
: 1.2%
|
12. HH and population
according to caste
|
S.N
|
Caste
|
HH
|
Population
|
|
1.
|
Chhetri
|
15164
|
82796
|
|
2.
|
Tamang
|
5990
|
32699
|
|
3.
|
Brahman
|
4085
|
22300
|
|
4.
|
Newar
|
3592
|
19609
|
|
5.
|
Thami
|
2875
|
15695
|
|
6.
|
Sherpa
|
2284
|
12468
|
|
7.
|
Kami
|
1397
|
7626
|
|
8.
|
Jirel
|
870
|
4749
|
|
9.
|
Damai
|
822
|
4487
|
|
10.
|
Magar
|
627
|
3423
|
|
11.
|
Sharki
|
602
|
3286
|
|
12.
|
Sunuwar
|
426
|
2326
|
|
13.
|
Gurung
|
281
|
1534
|
|
14.
|
Yogi
|
215
|
1175
|
|
15.
|
Majhi
|
95
|
519
|
|
16.
|
Bhujel
|
50
|
273
|
|
17.
|
Surel
|
33
|
180
|
|
18.
|
Others
|
537
|
2073
|
|
Total
|
39945
|
217218
|
13. Language
|
Nepali
|
: 71.71 %
|
|
Tamang
|
: 15.03 %
|
|
Sherpa
|
: 5.73 %
|
|
Jirel
|
: 2.18 %
|
|
Newari
|
: 1.75%
|
|
Sunwar
|
: 1.07%
|
|
Others
|
: 2.53 %
|
14.
Religion
|
Hindu
|
: 71.05 %
|
|
Boudha
|
: 28.53 %
|
|
Others
|
: 0.36%
|
15.
Education
|
Literacy Rate
|
: 48.98
|
|
Male
|
: 61.74
|
|
Female
|
: 36.23
|
|
Number of Primary
School
|
: 297
|
|
Number of lower
secondary School
|
: 34
|
|
Number of Secondary
School
|
: 39
|
|
Number of higher
Secondary School
|
: 5
|
|
Number of Campus
|
: 3
|
|
Number of technical
School
|
: 2
|
|
Number of
Pre-Primary/Primary Students
|
: 45678
|
|
Number of Lower
secondary students
|
: 8527
|
|
Number of secondary
school
|
: 3159
|
|
Number of Higher
secondary Students
|
: 469
|
|
Number of campus
students
|
: 433
|
|
Number of technical
school student
|
: 309
|
|
Number of total
teachers
|
: 1283
|
|
Number female teacher
|
: 172
|
16. Health
|
Number of Sub health
post
|
: 43
|
|
Number of health post
|
: 10
|
|
Number of primary
health center
|
: 1
|
|
Number of hospital
|
: 2
|
|
Family Planning
|
: 11.3 %
|
|
Crude birth rate
|
: 35.6/ Thousand
|
|
Crude mortality rate
|
: 10.1/Thousand
|
|
Child mortality rate
|
: 66/Thousand
|
|
Infant Mortality Rate
|
: 49.5/thausannd
|
|
Fertility Rate
|
: 4.385
|
|
Maternal mortality
rate
|
: 350 / Lakh
|
|
HH with toilet
|
: 31.9 %
|
|
Average marriage age
(girls)
|
: 19.5 Year
|
|
Drinking water by
pipeline
|
: 73.79%
|
|
Others
|
: 26.21 %
|
17. Transport and
communication
|
Post Offices
(District, Illaka & VDC level)
|
: 54
|
|
Number of telephone
|
: 500
|
|
Black topped road
|
: 86.06 KM
|
|
Graveled road
|
: 20.00KM.
|
|
Earthen road
|
: 73KM
|
|
Tracked road
|
: 40 km.
|
18. Electricity
|
National Greed
|
: 4772 HH
|
|
Micro-hydro
|
: 361 HH
|
|
Peltric Set
|
: 50 HH
|
|
Solar
|
: 40 HH
|
19. Crop cover area and
production (Average per year)
|
Crop
|
Area (Hac.)
|
Product (Mt.)
|
|
Paddy
|
3100
|
7751
|
|
White
|
5400
|
8640
|
|
Maize
|
5356
|
9855
|
|
Millet
|
3593
|
3887
|
|
Potato
|
2403
|
16821
|
|
Vegetable
|
1200
|
8344
|
|
Fruit
|
4530
|
-
|
20. Livestock Production
(Average per year)
|
S.N
|
Description
|
Quanity
|
|
1
|
Cheese
|
39000 kg.
|
|
2
|
Milk
|
12161 mt.
|
|
3
|
Meat
|
2166 mt
|
|
4
|
Eggs
|
1119100 Nos
|
|
5
|
Makhan
|
12500 kg.
|
|
6
|
Woll
|
11188 kg.
|
|
7
|
Leather
|
6174 kg.
|
21. Natural resources
Water resource
Tamakoshi,
Charnawoti,, Gumukhola, Singati khola, Doltikhola, Gopikhola, Ghyangkhola,
Andherikhola, Miltikhola, Khimtikhola.
Forest Resource
Chiraito,
Pakhanbet, Thulo Okhati, Nagbeli, Jatamashi, Allo, Majito, Sunpati, Argeli,
Lokta, Kudki, Sugandawal, Bikhma,, Machhino etc.
22.
Wild animals
Tiger, Bear, Rabbit, Deer,
Jackal ect.
23.
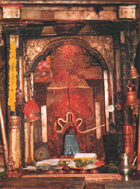
Religious and tourism place
Temple of Bhimeshwor, Temple
of Kalinchwok, Panch pokhari, Jatapokhari, Hill of Shailung, Beding Village,
Gaurishankar, Chhorolpa glacier lack, Deulangeshor mahadev ete.
24.
Status of small and cortege Industries
|
Bear on Agriculture
based
|
: 268
|
|
Bear on Forest based
|
: 76
|
|
Bear on Service based
|
: 283
|
|
Bear on Tourism
|
: 10
|
|
Bear on Mine
|
: 9
|
|
Bear on Others
|
: 61
|
|
Total
|
: 707
|
Indicator of Dolakha
|
S.N.
|
Indicator of
development
|
Position of Dolakha
district
|
Rank of dolakha district
|
|
1.
|
Ranked according to
the overall composite index of development
|
24
|
Worst
district
|
|
2.
|
Ranked according to
the poverty and deprivation
|
23
|
Worst
district
|
|
3.
|
Ranked according to
the women empowerment index
|
29
|
Intermediate
district
|
|
4.
|
Ranked according to
the natural resources endowment index
|
43
|
Intermediate
district
|
|
5.
|
Ranked according to
the socioeconomic infrastructure index
|
18
|
Worst
district
|
|
6.
|
Child literacy rate
(illiterate children of 10- 14 years as a percent of the total children in
the same age group )
|
38.11
|
Intermediate
district
|
|
7.
|
Child labor rate
(working children of 10- 14 years as a percent of the total children in
the same age group )
|
35.64
|
Intermediate
district
|
|
8.
|
Child marriage rate
(Married children of 10- 14 years as a percent of the total children in
the same age group )
|
2.28
|
Best
district
|
|
9.
|
Gender imbalance ratio
in literacy status (Ratio of females to males among the literatre
population of 15+ years ,multiplied by their sex ratio of the same age
group )
|
22.85
|
Worst
district
|
|
10.
|
Gender imbalance ratio
in non agricultural occupation (Ratio of females to males among the
literate population of 15+ years engaged in non agricultural occupations
,multiplied by their sex ratio of the same age group )
|
20.20
|
Intermediate
district
|
|
11.
|
Percentage of
educationally disadvantaged population (Educationally disadvantage ethnic
population as a percent of the total population )
|
23.85
|
Intermediate
district
|
|
12.
|
Percentage of ladles
and marginal farm household (Ladles and marginal farm household (<0.5ha
)as a percent of the total farm household multiplied by the proportion of
agricultural labor force )
|
48.22
|
Worst
district
|
|
13.
|
per capita food
production (Caloric values of food production divided by the rural
population ,adjusted for adult equivalence )
|
1164
|
Worst
district
|
|
14.
|
Overall literacy rate
(Literate population 6 years and above as a percent of the total
population in the same age group )
|
34.40
|
Intermediate
district
|
|
15.
|
Infant mortality rate
(average number of deaths under one year of age per 1000 live births )
|
64
|
Best
district
|
|
16.
|
Contraceptive
prevalence rate (The number of fertile couples using contraceptives per
100 married women of reproductive age )
|
19.90
|
Intermediate
district
|
|
17.
|
Drinking water
coverage (Percentage of population who have access to safe drinking water)
|
57.87
|
Intermediate
district
|
|
18.
|
Board occupational
structure (Ratio of labor force(economically active population of 15+
years ) engaged in non agricultural occupations to those engaged in
agriculture)
|
7.99
|
Worst
district
|
|
19.
|
Agricultural credit
(Percent of farm households reported to have institutional agricultural
credit)
|
7
|
Worst
district
|
|
20.
|
Farm size (Operational
area divided by the number of farm households)
|
0.64
|
Worst
district
|
|
21.
|
Livestock per farm
household (Sum of Weighted livestock (cattle ,buffalo ,goat, sheep and
chauri ) divided by farm households)
|
3.24
|
Worst
district
|
|
22.
|
cropping intensity
(Area under temporary crops, cash crops( food crops, cash crops, pluses
and vegetables ) divided by arable area )
|
148.21
|
Worst
district
|
|
23.
|
percentage of
irrigated area (Year round irrigated land area as a percent of net
cultivated area)
|
8.61
|
Intermediate
district
|
|
24.
|
Road density (Weighted
sum of different categories of road in KM. as a percent of 100sq Km of
total surface area )
|
4.42
|
Intermediate
district
|
|
25.
|
Banks (Number of bank
per population divided by population distance)
|
0.01
|
Best
district
|
|
26.
|
cooperatives (Number
of cooperatives per population divided by population distance)
|
0.25
|
Best
district
|
|
27.
|
Health
institution(Number of health institutions per population divided by
population distance)
|
0.19
|
Intermediate
district
|
|
28.
|
Per capita regular
budget
|
364
|
Intermediate
district
|
|
29.
|
Per capita development
budget allocation
|
465
|
Intermediate
district
|
|
30.
|
Post office (Number of
post office per population divided by population distance)
|
0.18
|
Worst
district
|
|
31.
|
Percentage of forestry
user household (Percent of total households who are members of forestry
user groups)
|
17.08
|
Intermediate
district
|
|
32.
|
Percentage share of
females in literacy (Literate female population of 10+ years as a percent
of the total literate population in the same age group)
|
24.03
|
Intermediate
district
|
|
33.
|
Percentage share of
females in non agricultural occupations ( Females population of 15+ years
engaged in non agricultural occupations as a percent of the total
population in the same age group engaged in the same activities )
|
19.10
|
Worst
district
|
|
34.
|
Percentage share of
elected females at district level ( Number of female elected on to VDCs ,DDCs,
and municipalities as a percent of the total members elected )
|
0.16
|
Worst
district
|
|
35.
|
Percentage share of
females teachers at primary level ( Number of female teachers in primary
schools as a percent of the total primary teachers )
|
13.57
|
Worst
district
|
|
36.
|
Percentage share of
girl enrolled in primary level ( Number of girls enrolled as a percent of
total enrollment at a primary level )
|
35.05
|
Intermediate
district
|
|
37.
|
Percentage of girl
dropouts at primary level ( Average percentage of girls dropouts from
grades 1to 5 )
|
18.79
|
Worst
district
|
|
38.
|
Percentage of area
with slopes above 30 degrees ( Land with slopes above 30 degrees as
percent of the total surface area )
|
69.65
|
Worst
district
|
|
39.
|
Per capita forest area
( Per capita forest area with more than 10 percent crown density )
|
0.43
|
Intermediate
district
|
|
40.
|
Percentage of sloping
terrace area ( Percentage of mapped area of sloping terraces ( slopes 4-30
degrees ) in the total mapped cultivated area )
|
13.17
|
Intermediate
district
|
|
41.
|
Percentage of
grassland area (Grassland area as a percent of the total surface area )
|
15.93
|
Best
district
|
|
42.
|
Percentage of
cultivated area(Net cultivated area as a percent of the surface area )
|
11.22
|
Worst
district
|
|
43.
|
Ratio of
non-cultivated area to cultivated area (Ratio of non- cultivated area
(forests, shrub land , grass landsand non cultivated inclusions within the
mapped cultivated area ) to cultivated area )
|
6.22
|
Best
district
|
|
44.
|
Gross rural population
density(Density of Rural population )
|
0.81
|
Best
district
|
|
45.
|
Ranked by child
deprivation index
|
41
|
Intermediate
district
|
|
46.
|
Ranked by gender
discrimination index
|
24
|
Worst
district
|
|
47.
|
Ranked by health and
development index
|
49
|
Intermediate
district
|
|
48.
|
Ranked by primary
sector development index
|
33
|
Intermediate
district
|
|
49.
|
Ranked by
infrastructure development index
|
27
|
Intermediate
district
|
copyright © DolakhaNepal 2004
|
|